Add Controls to a Report
This document describes how to add controls to a report.
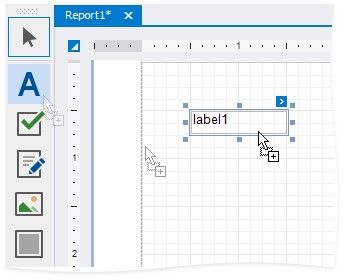
Add Controls from the Standard Controls Bar
Use the End-User Designer's Toolbox to add controls to your report.
Add Data-Bound Controls from the Field List
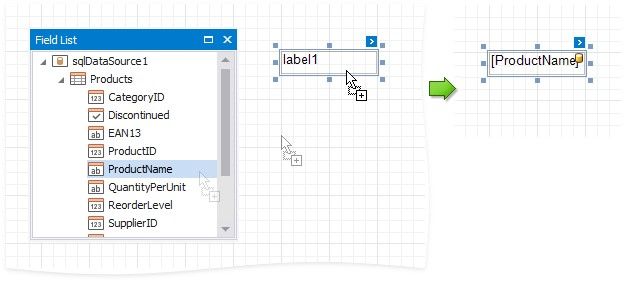
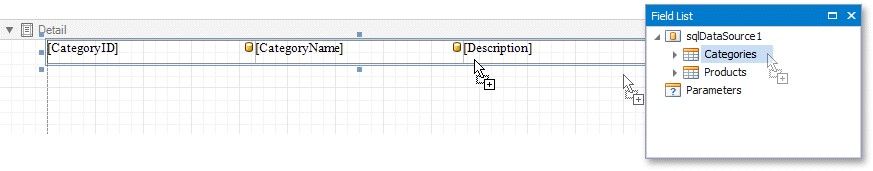
You can drag fields from the Field List onto your report to add data-bound controls, after you bound your report to a data source.
Add a Control
Drag a field from the Field List and drop it onto the report's surface.
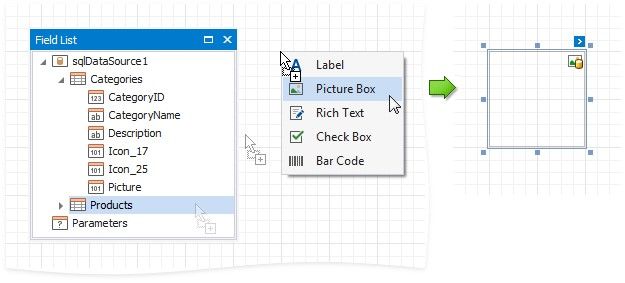
To add a control of specific type, do either of the following:
Hold down the SHIFT key and drop a data field onto a report's surface. Right-click a data field and drop it onto a report's surface.
This invokes a context menu where you can select which control to add.
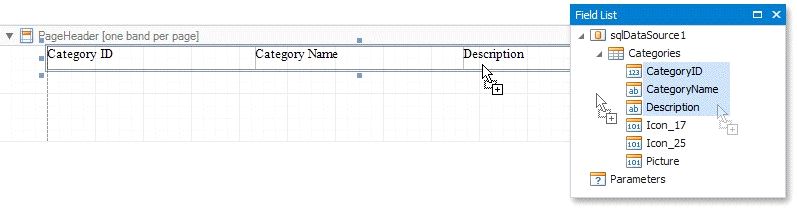
Add a Table
Hold the CTRL or SHIFT key and click several fields. Drop them onto the report's surface to add a table with its cells bound to these fields.
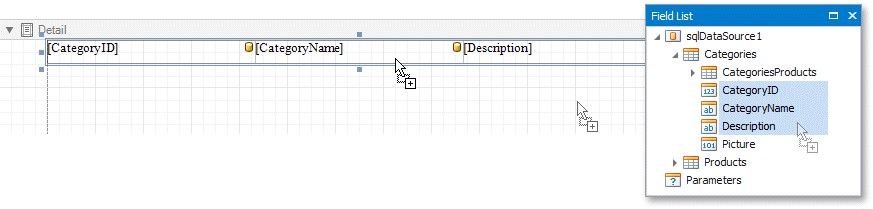
Drop an entire data table from the Field List to add a report table with columns bound to the data table's fields.
To add column headers, do either of the following:
Add Content from External Sources
You can add text and graphics from external applications to your reports:
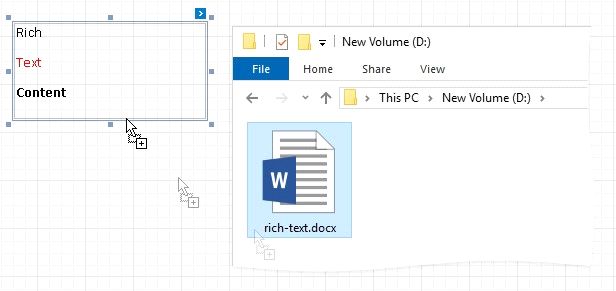
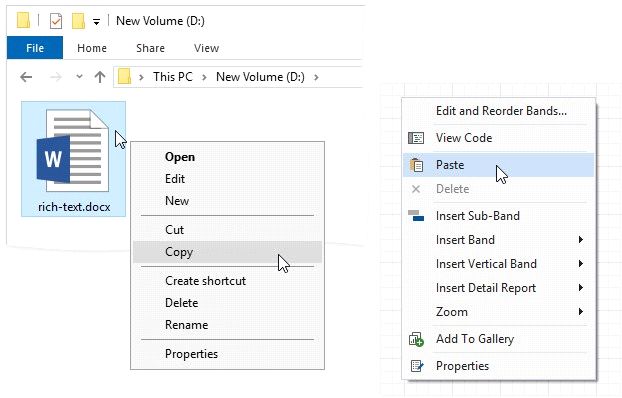
Drag a file, text or image from an external application onto your report.
The following table shows which file types transform into report controls:
FILE T YPE |
CONTROL |
.TXT |
A Label control that contains file contents. |
.DOC, .DOCX, .RTF, .HTM, .HTML |
A Rich Text control that contains file content. |
.JPG, .PNG, .BMP, .GIF, .TIF, .SVG |
A Picture Box control that contains the image. |