Table Report
The topics in this section describe how to create a table report and connect it to data at design time within Visual Studio using the Data Source Wizard.
To create a new report and connect it to data, run the Report Wizard and select Table Report.
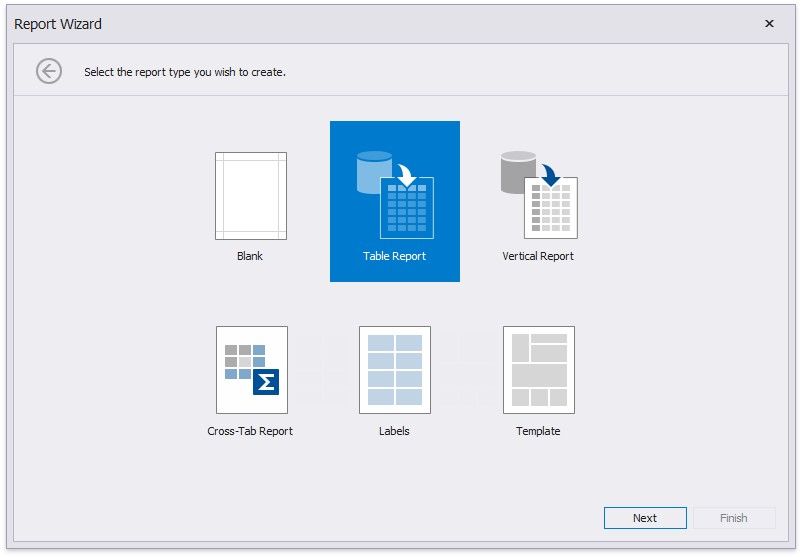
The Report Wizard can include the following pages:
Select the Data Source Type
Choose Fields to Display in a Report
Add Grouping Levels
Specify Summary Options
Specify Report Page Settings
Specify a Report Color Scheme
Set the Report Title
Select the Data Source Type
This wizard page allows you to select the required data source type.
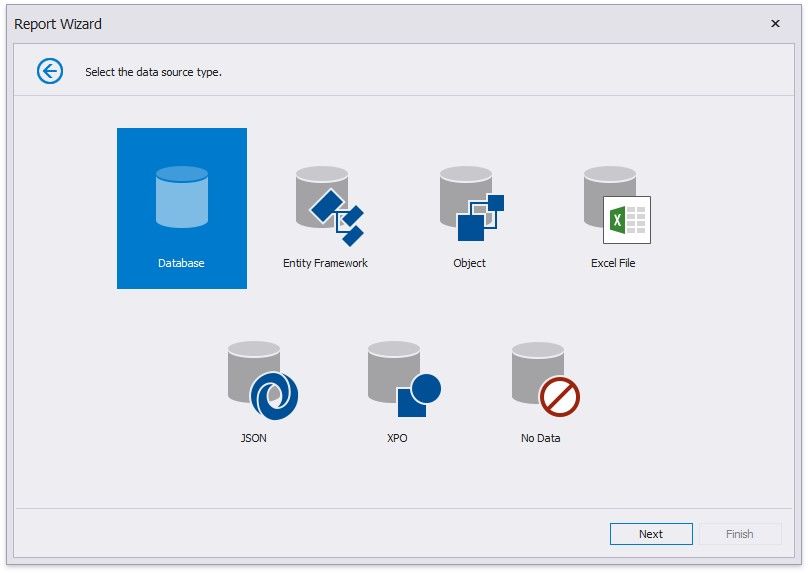
Click Next to proceed to the next wizard page, depending on the selected data source type.
Connect to a Database
Connect to an Entity Framework Data Source
Connect to an Object Data Source
Connect to an Excel Date Source
Connect to JSON Data Source
Connect to XPO Data Source
No Data
Choose Fields to Display in a Report
This wizard page allows you to select data members for a report and its detail reports as well as choose data fields to display in these reports.
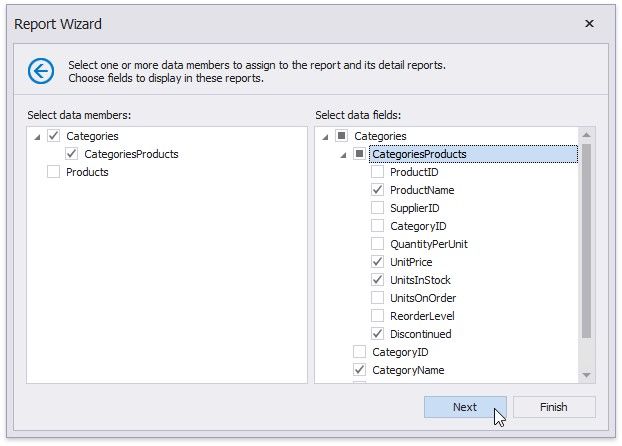
The list on the left-hand side displays queries and master-detail relationships specified on the previous wizard page. Select required check boxes to create relevant reports and assign their DataMember property.
In the list on the right-hand side, choose data fields from the selected data members to include into corresponding reports.
After completing the wizard, the report is constructed according to the following:
If you select one query, it assigns to the report's DataMember property. The selected fields with corresponding captions are automatically added to the report's Detail Band.
If you select two or more queries, this creates the Detail Report Band for each query at the same hierarchical level. The DataMember properties of these detail reports are assigned to the corresponding queries.
For each selected master-detail relationship, the Detail Report Band with the DataMember property set to this relationship is created under the corresponding master report.
You can stop the wizard at this step by clicking Finish. The created report looks similar to the image below.
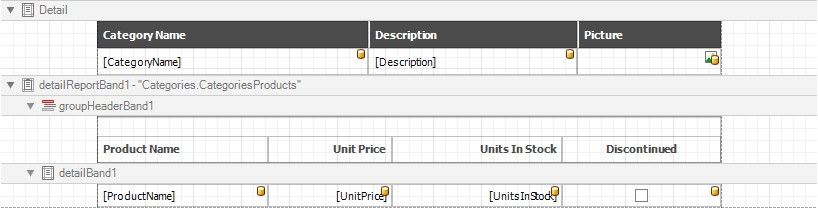
If you want to customize the report further, click Next to go to the Add Grouping Levels page.
Add Grouping Levels
This page allows you to group data in your report. If you do not need to group your data, simply click Next on this page to skip this step.
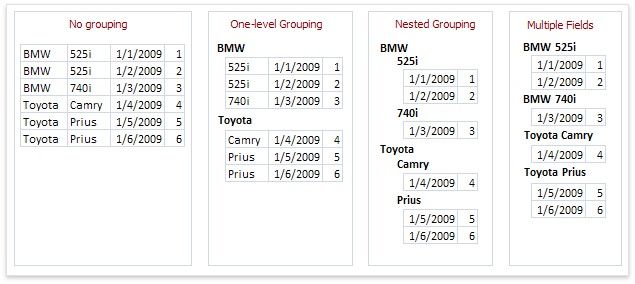
Nested grouping and grouping against multiple fields are fully supported. The following image illustrates all basic grouping types.
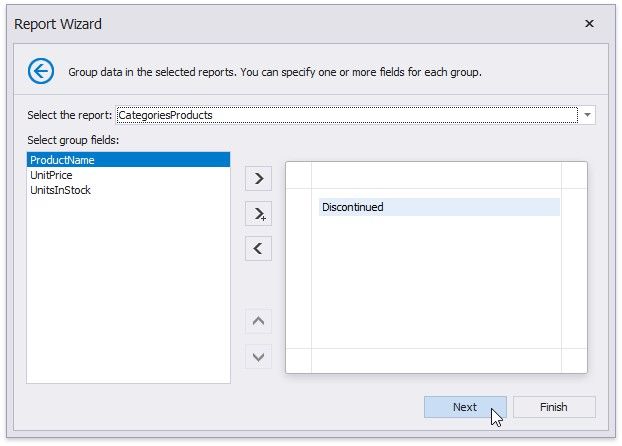
The list on the left-hand side displays data fields that can be used to group data. To apply grouping, do one of the following.
Select columns and click the right arrow button. Double-click columns.
To remove a grouping field, double-click it in the list on the right-hand side, or select it and click the left arrow button. You can also change the order of grouping fields using the up arrow and down arrow buttons.
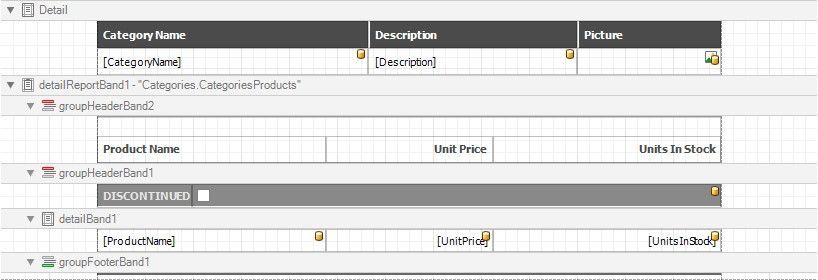
You can stop the wizard on this step by clicking Finish. In this case, your report will look similar to the image below.
If you want to customize your report further, click Next. If data grouping has been applied on this page, you will proceed to the Specify Summary Options page. If you have not grouped your data, you will skip the summaries step and go to the Specify Report Page Settings page.
Specify Summary Options
On this wizard page, you can specify summaries to calculate in the selected reports.
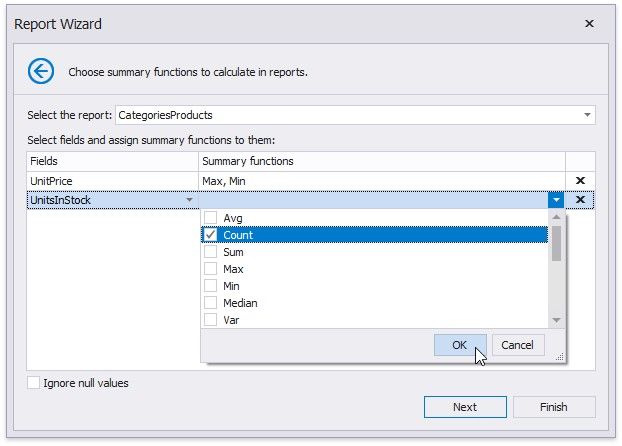
Use the drop-down list at the top of the wizard page to choose a required report.
In the Fields table column, you can select an available numerical or date-time field. To specify which functions should be calculated for the selected field, enable the corresponding check boxes in the Summary functions drop-down.
The specified summaries are displayed in the report footer and after corresponding groups (if you have grouped report data on the previous wizard page).
If data fields can contain empty values and you do not want to take these values into account when calculating totals, select the Ignore null values check box. Otherwise, these values are treated as zeros for numeric fields and the earliest system date for date-time fields.
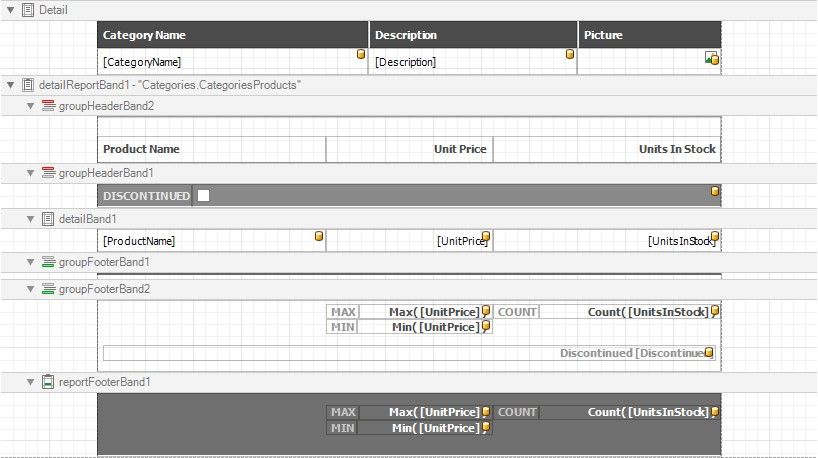
You can stop the wizard at this step by clicking Finish. The created report looks similar to the image below.
If you want to customize the report further, click Next to proceed to the next wizard page: Set the Report Title.
Specify Report Page Settings
At this step, set up the report's page.
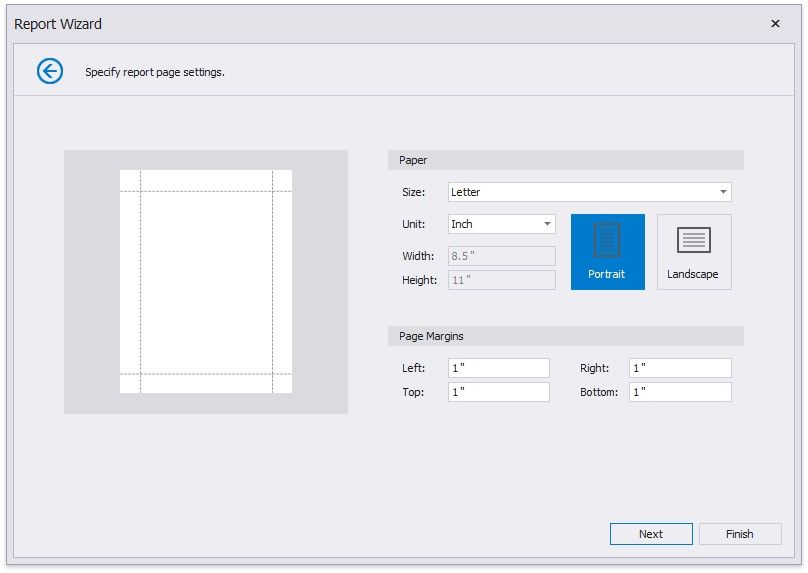
This wizard page allows you to specify the following report properties:
Report Page Size
Unit
Choose between Inch, Millimeter and Pixel to specify size options on this wizard page. After you finish the wizard, the Report Designer transforms the specified units to HundredthsOfAnInch, TenthsOfAMillimeter or Pixels to provide a more precise report element alignment.
Width and Height
These properties are read-only until you set the Size option to Custom.
Page Margins
Use the report page preview to drag the margins to a required position.
Page Orientation
You can change these settings after you finish the wizard in the Report Designer's Property Grid.
If you want to customize the report further, click Next to proceed to the next wizard page: Choose a Report Color Scheme. Otherwise, click Finish to complete report customization.
Choose a Report Color Scheme
This page allows you to choose a base color for report styles.
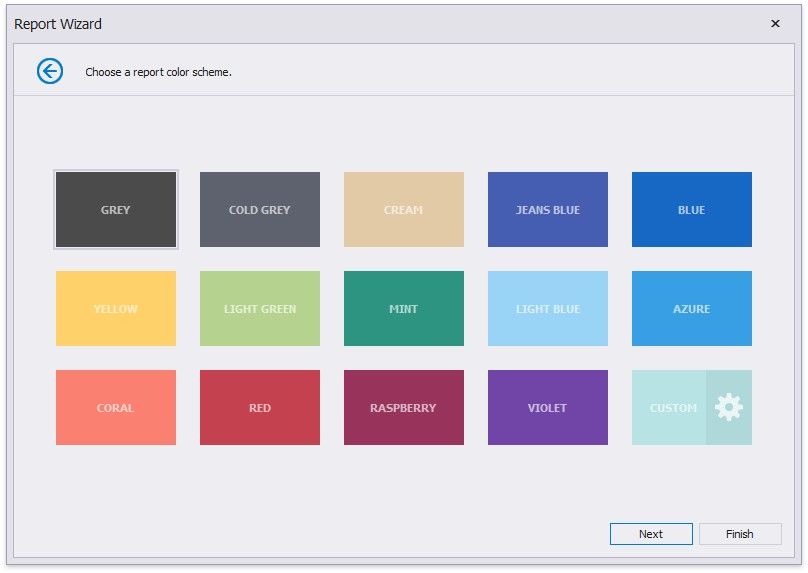
The wizard creates styles based on the chosen color for the first level report controls and applies styles with more transparent colors to controls on deeper levels.
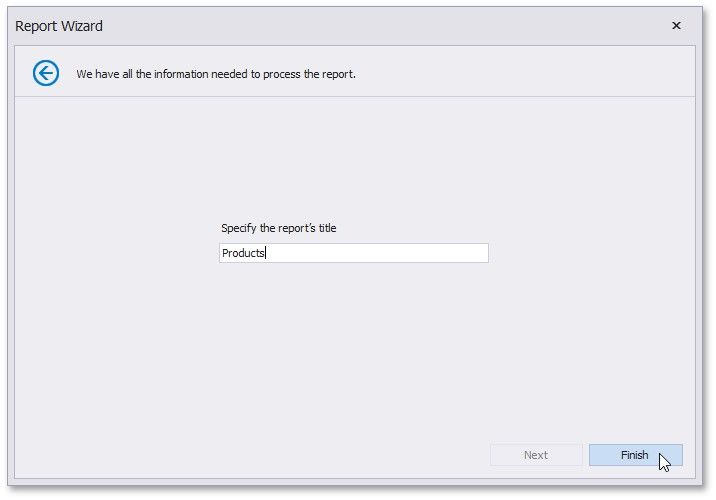
Set the Report Title
On this page, specify the title for the report and click Finish to exit the wizard.