Interactivity
This section describes features that enable interaction between the Chart and other dashboard items. These features include Master Filtering and Drill-Down.
The section contains the following topics.
Master Filtering
Drill-Down
Master Filtering
The Dashboard allows you to use any data aware dashboard item as a filter for other dashboard items (Master Filter). To learn more, see the Master Filtering topic, which describes filtering concepts common to all dashboard items.
The Chart dashboard item supports filtering by argument, series or points.
Filtering by Arguments
When filtering by arguments is enabled, you can click series points to make other dashboard items only display data related to selected argument values.
To enable filtering by arguments in the Designer, set the required Master Filter mode and click the Arguments button in the Data Ribbon tab (or the ![]() button if you are using the toolbar menu).
button if you are using the toolbar menu).
Filtering by Series
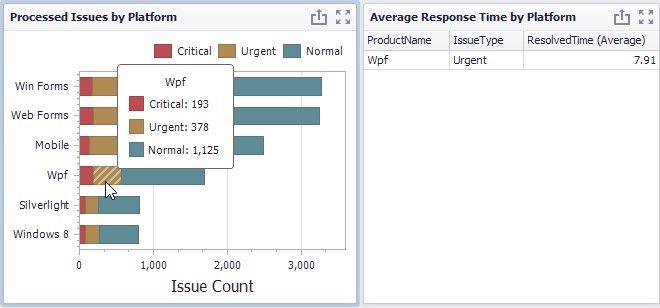
When filtering by series is enabled, you can click a series point to make other dashboard items only display data related to the selected series.
To enable filtering by series in the Designer, set the required Master Filter mode and click the Series button in the Data Ribbon
tab (or the ![]() button in the Data Ribbon
button in the Data Ribbon 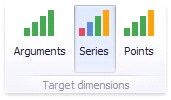 button if you are using the toolbar menu).
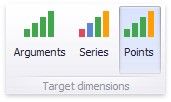
Filtering by Points
When filtering by points is enabled, you can click a individual point to make other dashboard items display only data related to the selected point.
To enable filtering by points in the Designer, set the required Master Filter mode and click the Points button in the Data Ribbon tab.
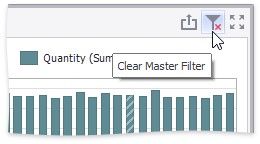
Reset Filtering
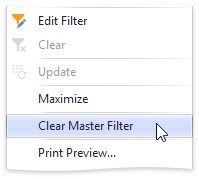
To reset filtering, use the Clear Master Filter button in the Chart's caption area…
…or the corresponding command in the Chart's context menu.
Drill-Down
The built-in drill-down capability allows you to change the detail level of data displayed in dashboard items on the fly. To learn more about drill-down concepts common to all dashboard items, see the Drill-Down topic.
The Chart dashboard item supports drill down on argument or series values.
Drill Down on an Argument
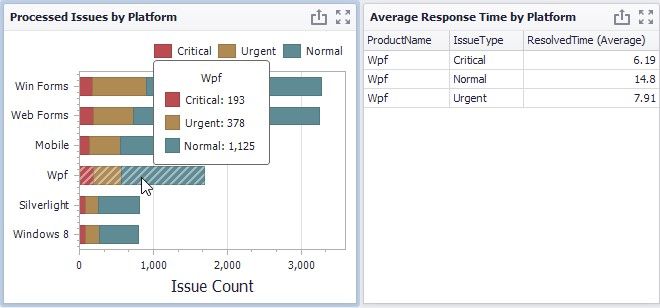
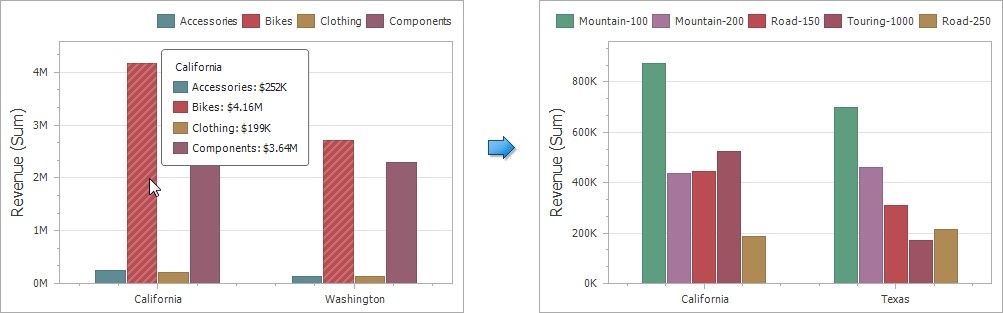
When drill down on arguments is enabled, you can click a series point to view a detail chart for the corresponding argument value.
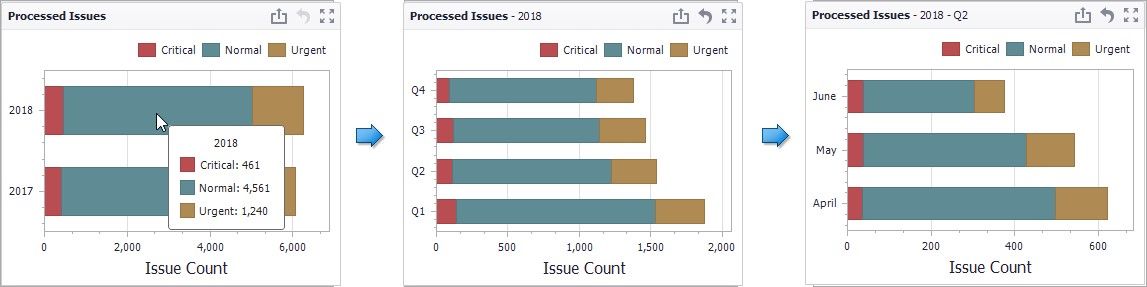
Drill down on arguments requires that the Arguments section contains several data items, from the least detailed to the most detailed item.
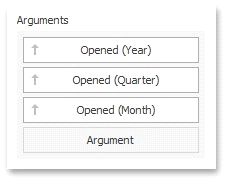
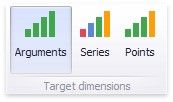
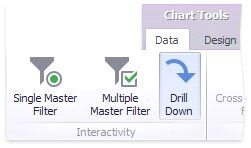
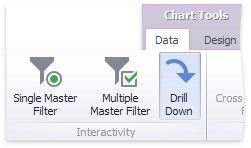
To enable drill down on arguments, click the Drill Down button in the Ribbon tab (or the ![]() button if you are using the toolbar .
button if you are using the toolbar .
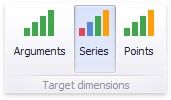
...and the Arguments button (or the ![]() button if you are using the toolbar menu).
button if you are using the toolbar menu).

Drill Down on a Series
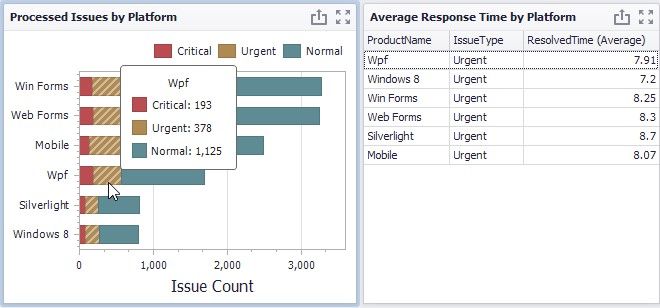
When drill down on a series is enabled, you can click a series point (or corresponding legend item) to view a detail chart for the corresponding series.
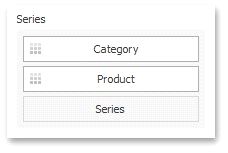
Drill down on a series requires that the Series section contains several data items, from the least detailed to the most detailed item.
To enable drill down on a series, click the Drill Down button in the Data Ribbon tab (or the ![]() button if you are using the toolbar menu)...
button if you are using the toolbar menu)...
 .
.
..and the Series button (or the ![]() button if you are using the toolbar menu).
button if you are using the toolbar menu).
Drill Up
To return to the previous detail level (drill up), use the Drill Up button within the Chart caption or in the context menu.