Coloring
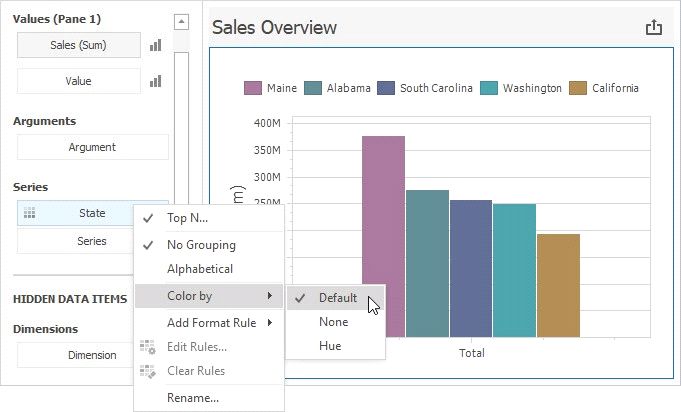
The Chart dashboard item paints different measures and series dimensions by hue in Default color mode. The image below shows the chart item whose State series dimension values are painted in different colors. A special icon (![]() ) on the data item shows that color variation is enabled.
) on the data item shows that color variation is enabled.