Customize the Chart
Improve the chart's appearance:
![]() Remove the chart legend, because the chart series are bound to the same data. Select Legend in the chart elements tree and disable the Visibility check box in the Options tab.
Remove the chart legend, because the chart series are bound to the same data. Select Legend in the chart elements tree and disable the Visibility check box in the Options tab.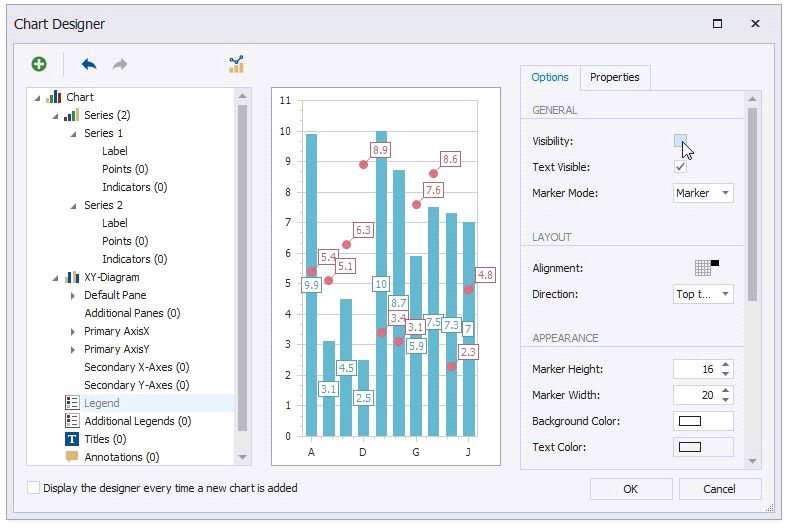
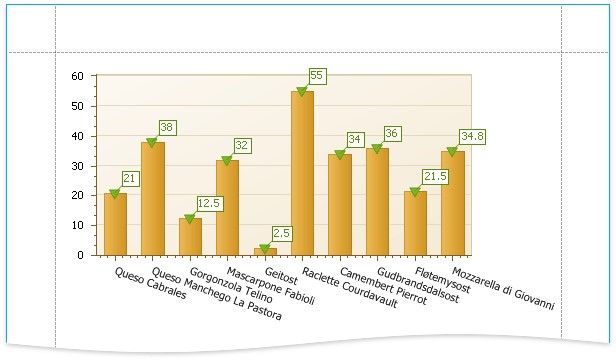
View the Result
Switch to Print Preview to preview your report.