Add Series to the Chart
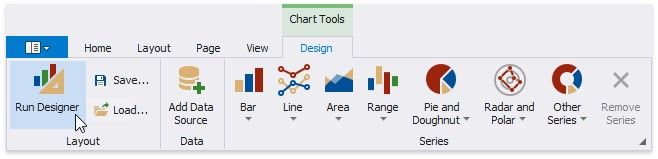
1.Select the chart. Switch to the Chart Tools toolbar tab and click Run Designer.
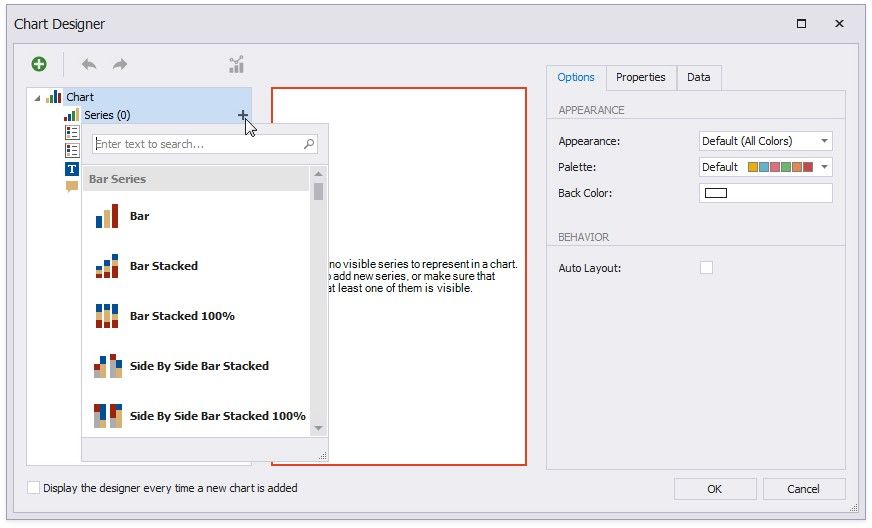
2.Add a new series to the chart.
Locate Series in the chart elements tree and click the plus button.
Select the series type (for example, Bar) from the invoked list.
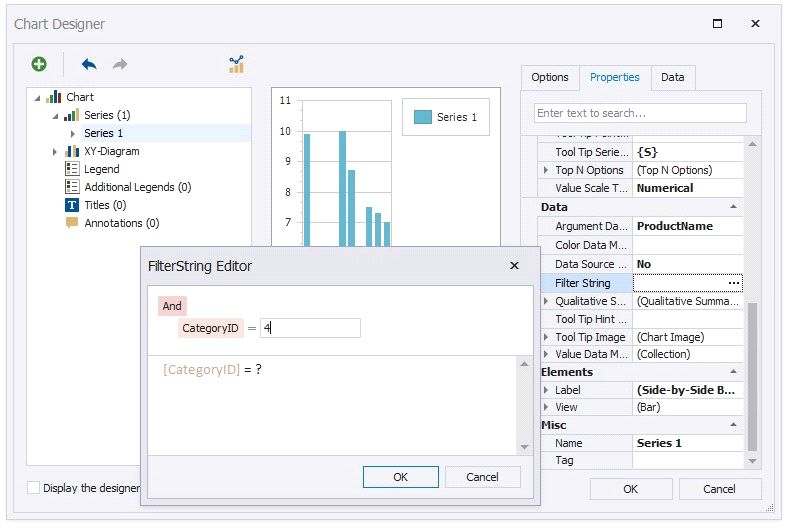
Switch to the Properties tab.
Click the Filter String property's ellipsis button.
5. Create another series with the same settings. Select the Point view type for this series.