Add a Chart to a Report
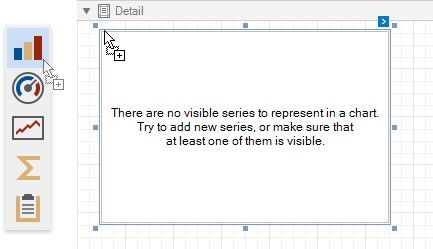
1.Drop the Chart control from the Toolbox onto the Detail band.
The Chart Designer wizard is invoked. Disable the Display the designer every time a new chart is added option if you do not want to trigger the wizard the next time you create a chart.
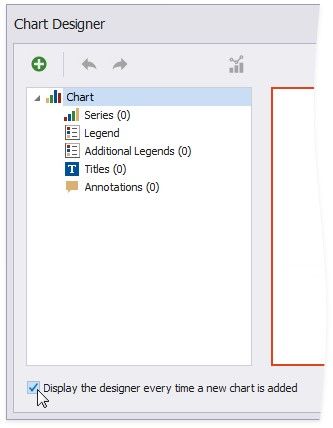
Close the wizard at this stage.
2.Click the chart's smart tag to bind the chart to data. Expand the Data Source property's drop-down and click Add New Data Source.
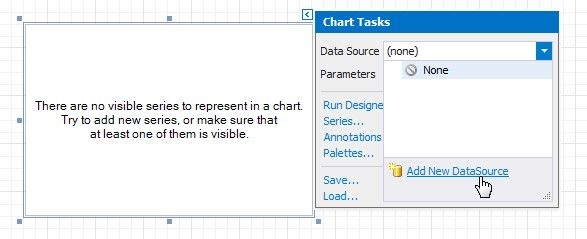
3.The invoked Data Source Wizard enables you to create a data source and bind the chart to it.
4.