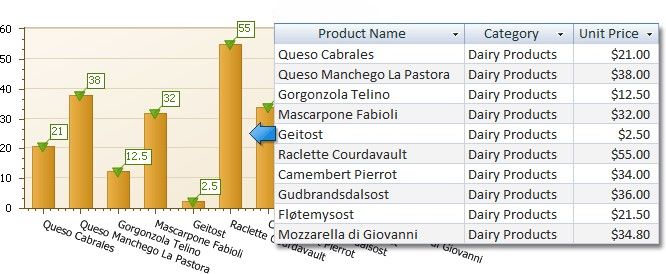
Add a Chart (Set Up Series Manually)
This document demonstrates how to add a chart to a report, provide data for chart series, and set up chart elements. This topic shows two chart series based on the same data source. You can use different data sources for different series.