Add a Chart (Use a Series Template)
This document describes how to create a report with a Chart control bound to data and generate all series automatically based on a common template.
Add a Chart to a Report
1.Drop the Chart control from the Toolbox onto the Detail band.
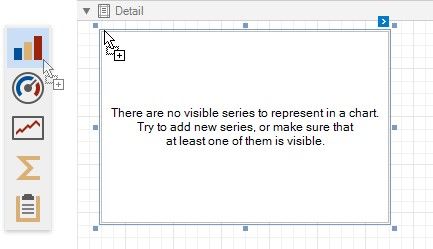
After you drop the chart, the Chart Designer is automatically invoked if its Display the designer every time a new chart is added option is enabled. Close the designer at this step.
2.Open the Toolbar's Chart Tools contextual tab and click Add Data Source to bind the chart to data.
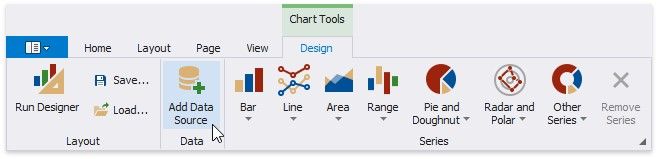
3.The invoked Data Source Wizard enables you to assign a data source to the chart. Bind the chart to a data source as described in the Bind to Data section.
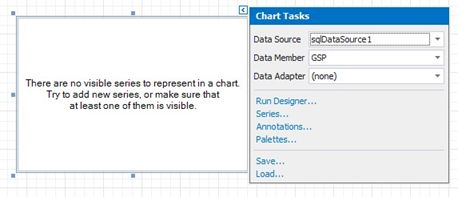
4.Click the chart's smart tag and make sure that the Data Source and Data Member properties were specified correctly.