Series
This section describes how to select a desired series type in the overview topic, and lists the variety of available series types.
The section consists of the following topics.
![]() Series Overview
Series Overview
Provides information on how to specify a series type in the Dashboard Designer.
![]() Bar Series
Bar Series
Lists the available types of bar series.
![]() Point and Line Series
Point and Line Series
Lists the available types of point and line series.
Area Series
Lists the available types of area series.
![]() Range Series
Range Series
Lists the available types of range series.
![]() Weighted Series
Weighted Series
Lists the available types of weighted series.
![]() Financial Series
Financial Series
Lists the available types of financial series.
Series Overview
The Chart dashboard item supports a variety of series types - from simple bar and line charts to complex candle stick and bubble graphs.
Bar Series
Point and Line Series
Area Series
Range Series
Weighted Series
Financial Series
This topic describes how to change the series type and specify various series options (for instance, how to use secondary axis or enable point labels).
Series Types
Series Options Series Point Labels
Series Types
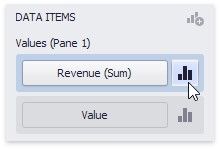
To switch between series types in the Dashboard Designer, click the Options button next to the required data item (or placeholder) in the Values section.
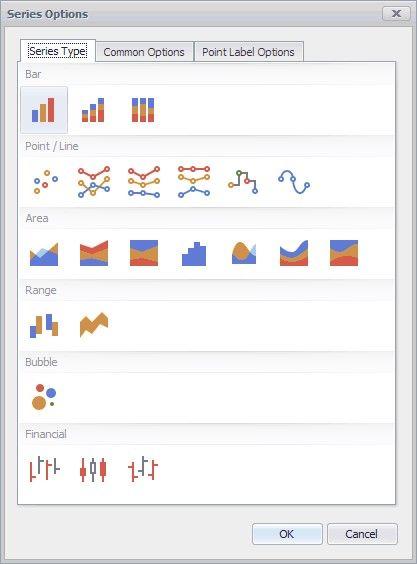
In the invoked Series Options dialog, select the required series type and click OK.
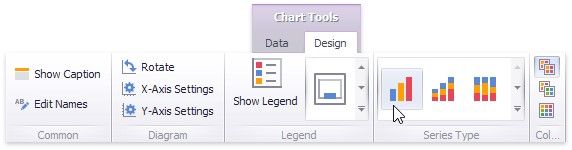
You can also do this using the Series Type gallery in the Design Ribbon tab.
Series Options
To manage common series options, use the Common Options tab of the Series Options dialog.
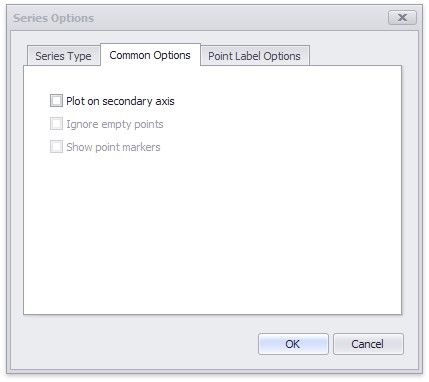
Plot on secondary axis - Specifies whether or not the secondary axis is used to plot the current series.
Ignore empty points - Specifies whether or not empty points are ignored when plotting the current series.
Note that this option is in effect for the Line, Area and Range Area series.
Show point markers - Specifies whether or not to show point markers for the current series.
Note that this option is in effect for the Line and Area series.
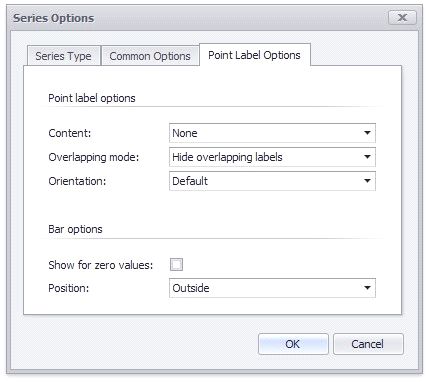
Series Point Labels
The Point Label Options tab of the Series Options dialog allows you to enable series point labels and manage their settings.
Bar Series
Bar series visualize data using rectangular bars with lengths proportional to the values that they represent.
The following types of Bar series are available.
Bar
Stacked Bar
Full-Stacked Bar
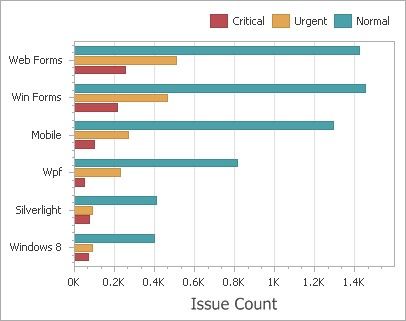
Bar
Bar series can be used to compare values across categories.
Stacked Bar
Stacked Bar series show the contribution of individual categories to the whole.
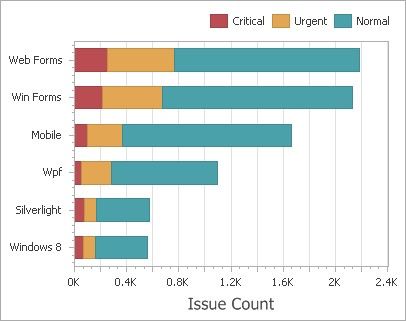
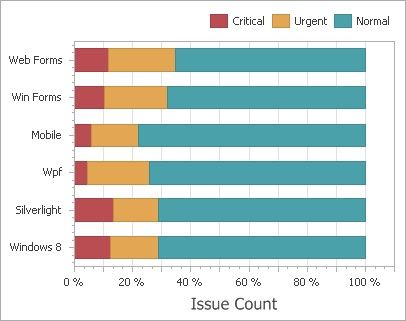
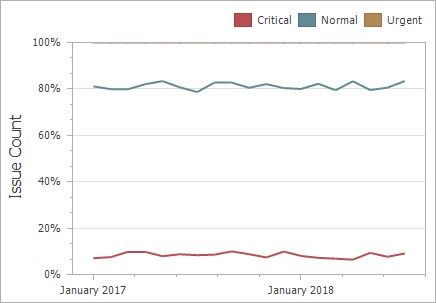
Full-Stacked Bar
Full-Stacked Bar series allow you to compare the percentage that each value contributes to a total across categories.
Point and Line Series
Point series visualize data as a set of individual numeric data points. Line series are used to connect numeric data points by different types of line segments.
The following types of Point and Line series are available.
Point
Line
Stacked Line
Full-Stacked Line
Step Line
Spline
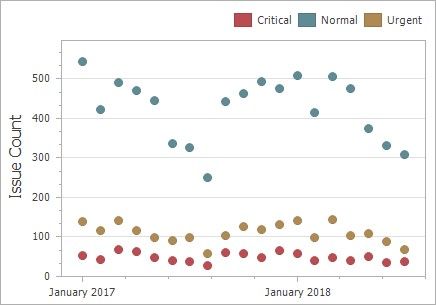
Point
Point series visualize data as a set of individual numeric data points.
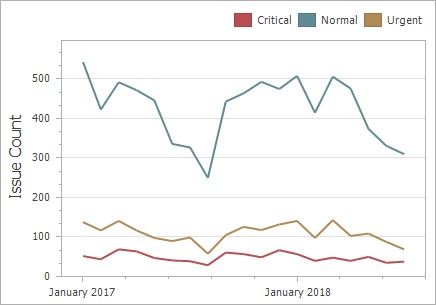
Line
Line series connect numeric data points by straight line segments.
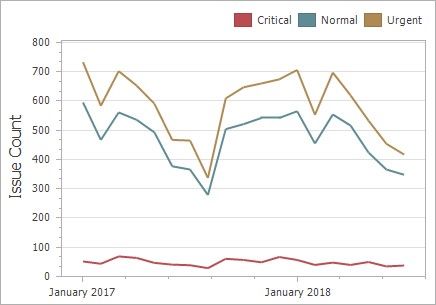
Stacked Line
Stacked Line series can be used to show the trend of the contribution for each value.
Full-Stacked Line
Stacked Line series are useful for showing the trend of the percentage for each value.
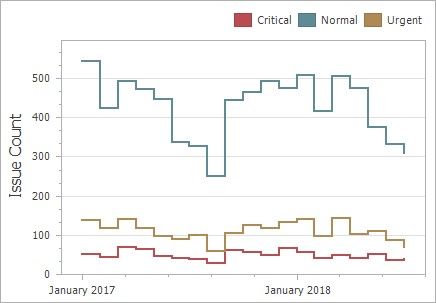
Step Line
Step Line series use vertical and horizontal lines to connect the numeric data points forming a step-like progression.
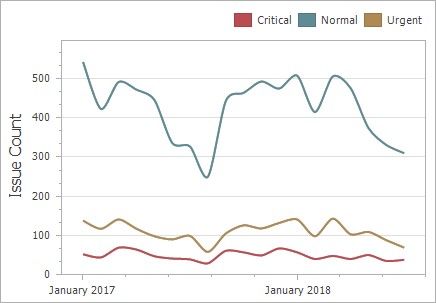
Spline
Spline series plot a fitted curve through each numeric data point.
Area Series
Area series connect numeric data points by different types of line segments and fill the area between the line and X-axis/other series.
The following types of Point and Line series are available.
Area
Stacked Area
Full-Stacked Area
Step Area
Spline Area
Stacked Spline Area
Full-Stacked Spline Area
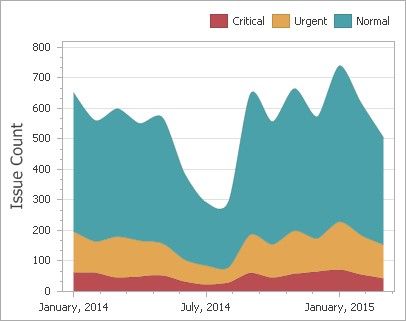
Area
Area series connect numeric data points by straight line segments and fill the area between the line and X-axis.
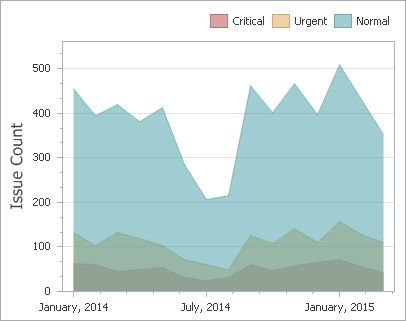
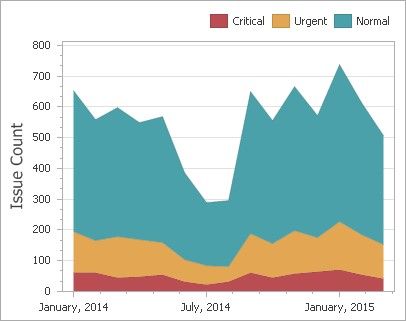
Stacked Area
Stacked Area series can be used to show the trend of the contribution for each value. Stacked Area series connect numeric data points by straight line segments and fill the area between the line and previous series.
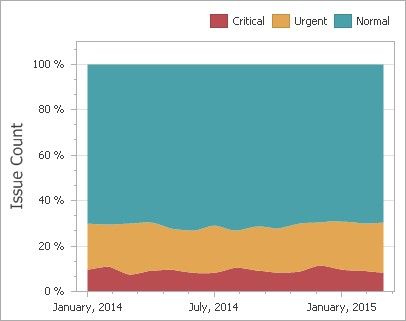
Full-Stacked Area
Full-Stacked Area series are useful to show the trend of the percentage for each value.

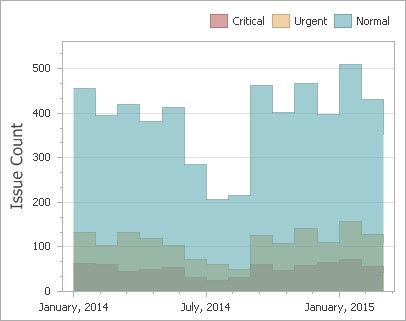
Step Area
Step Area series use vertical and horizontal lines to connect the numeric data points forming a step-like progression and fill the area between the line and X-axis.
Spline Area
Spline Area series plot a fitted curve through each numeric data point and fill the area between the line and X-axis.
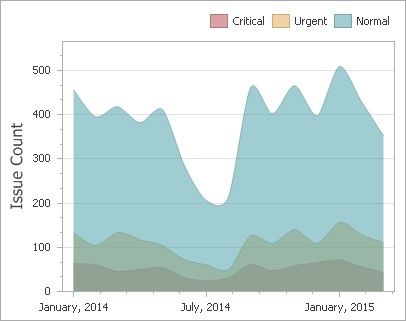
Stacked Spline Area
Stacked Area series can be used to show the trend of the contribution for each value. Stacked Area series plot a fitted curve through each numeric data point, and fill the area between the line and previous series.
Full-Stacked Spline Area
Full-Stacked Spline Area series are useful to show the trend of the percentage for each value.
Range Series
Range series are generally used to show variations in a specified time range like temperature, price, etc.
The following types of Range series are available.
Range Bar
Range Area
Data Binding Specifics
A range series is a space between two simple series displayed as a filled area (Range Area) or bars that stretch from a point in one series to the corresponding point in the other (Range Bar). Thus, you need to provide two measures instead of one to display a range series.
Value 1 - a measure against which the first set of values is calculated.
Value 2 - a measure against which the second set of values is calculated.
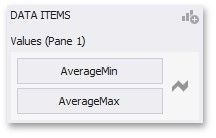
When you select the Range Bar or Range Area series type in the Designer, the DATA ITEMS area displays two data item placeholders. Drag and drop the required measures to corresponding placeholders.
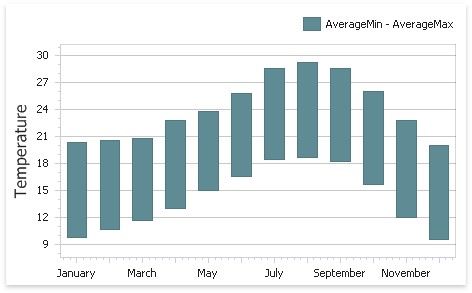
Range Bar
Range Bar series are similar to Bar series except that they are drawn between a range of values.
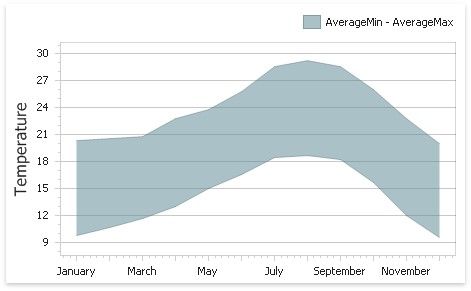
Range Area
Range Area series are similar to Area series except that their areas are filled between a range of values.
Weighted Series
Weighted series allow you to visualize data in three dimensions.
The following types of Weighted series are available.
![]() Bubble
Bubble
Data Binding Specifics
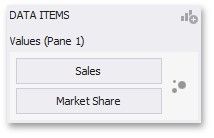
Data points in a weighted series present the following two measures.
Value - the Y-coordinate of series points. Weight - the size of series points.
When you select the Bubble series type in the Designer, the DATA ITEMS area displays two data item placeholders. Drag and drop the required measures to corresponding placeholders.
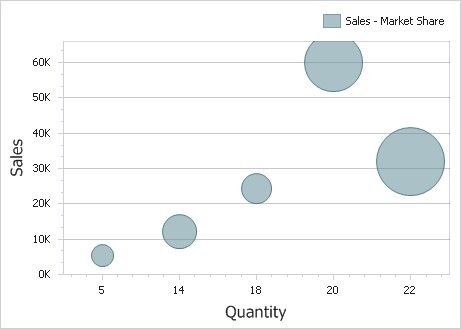
Bubble
Bubble series are similar to Point series except that they allow you to provide an additional measure whose values are expressed in a bubble size.
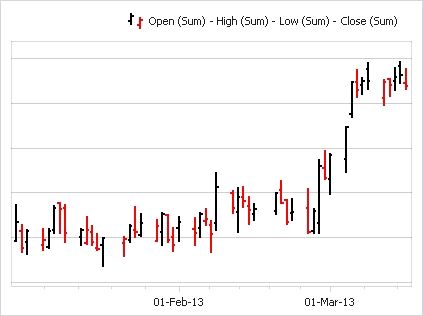
Financial Series
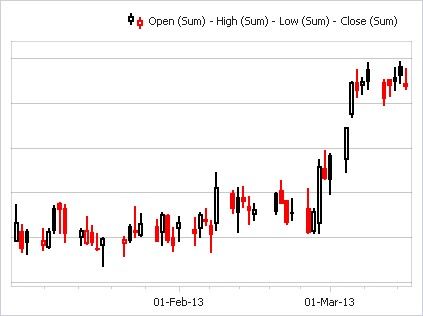
Financial series are used to illustrate stock prices.
The following types of Financial series are available.
High-Low-Close Stock
Candle Stick
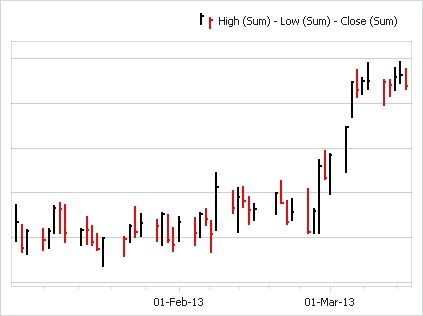
Coloring Specifics
Note that financial series do not support a standard coloring mechanism used to color chart series points. The Chart dashboard item colors series points of financial series in the following way.
Black if the price at the end of the previous period is lower than the price at the end of the current period. Red if the price at the end of the previous period is larger than the price at the end of the current period.
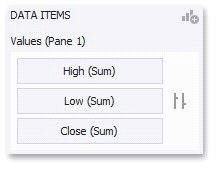
High-Low-Close
When you select the High-Low-Close series type in the Designer, the DATA ITEMS area displays three data item placeholders. High-Low-Close series require three measures to be provided.
Stock
When you select the Stock series type in the Designer, the DATA ITEMS area displays four data item placeholders. Stock series require four measures to be provided.
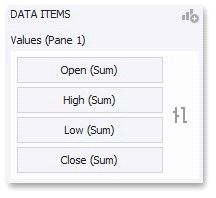
Candle Stick
When you select the Candle Stick series type in the Designer, the DATA ITEMS area displays four data item placeholders. Candle Stick series require four measures to be provided.
Open - the price at the beginning of the specified period.
High - the maximum price within the specified period (the upper shadow top).
Low - the minimum price within the specified period (the lower shadow bottom).
Close - the price at the end of the specified period.