Map Coloring
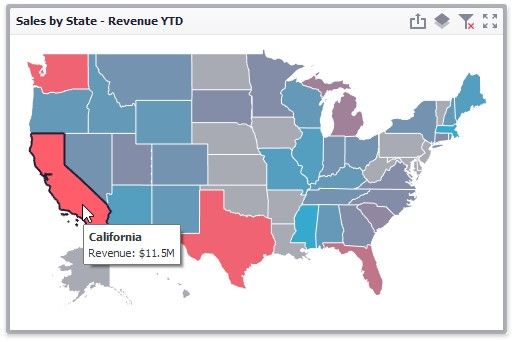
The Choropleth Map dashboard item colors map shapes depending on the data provided.
For instance, you can visualize a sales amount or population density.
Palette and Scale Settings
The Choropleth Map automatically selects palette and scale settings to color map shapes.
If you need to customize these settings, click the Options button next to the data item that contains these values.
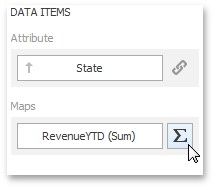
This invokes the Choropleth Map Options dialog.
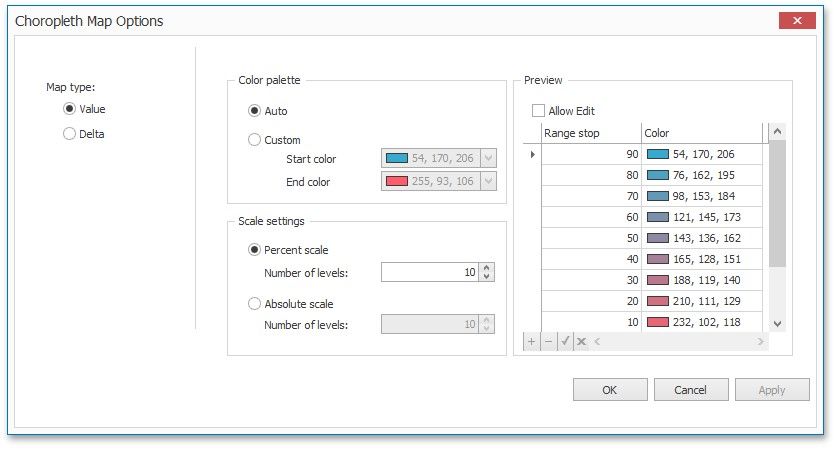
You can specify the following settings in this window.
Color palette - allows you to specify the start and end color of the palette.
Scale settings - specifies whether a percent scale or an absolute scale is used to define a set of colors. You can specify the number of levels that represent the number of colors used to color the map.
Preview is used to display a full set of palette colors generated based on the start/end colors and the number of levels. Use the Allow Edit check box to automatically change the generated colors or specify value ranges for each color.
To learn how to display a map legend, see Legend.
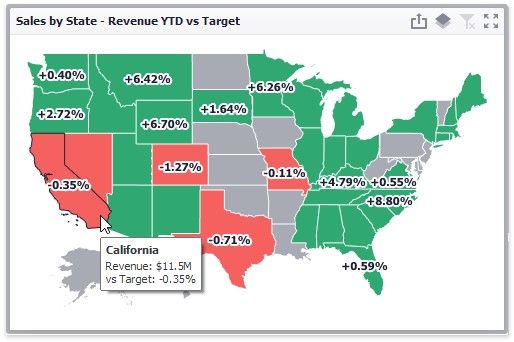
Also, the Choropleth Map allows you to visualize the difference between the actual and target values of a particular parameter. To learn more, see the Delta topic.
Delta
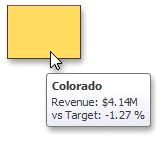
The Choropleth Map allows you to indicate the difference between the actual and target values of a particular parameter. This difference is called delta.
Delta Options
To specify delta indication settings, click the Options button next to the data item container.
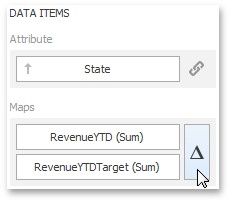
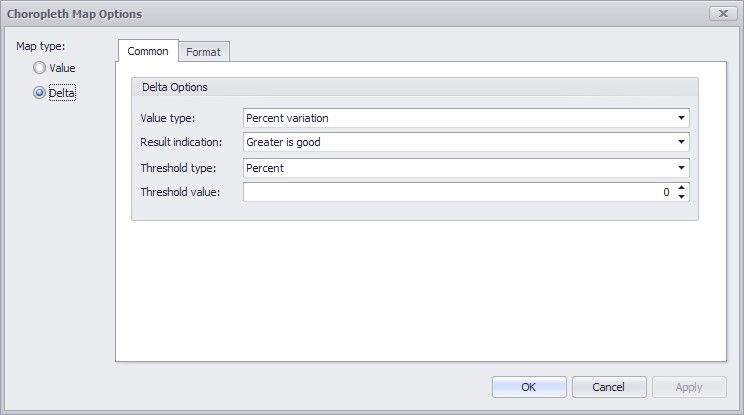
This invokes the Choropleth Map Options dialog. When the map type is set to Delta, this dialog contains the following settings.
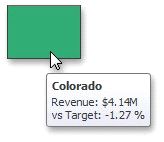
![]() Value Type
Value Type
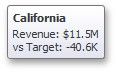
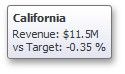
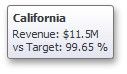
You can specify which values to display within map tooltips. Use the Value type combo box to select the value that will be displayed as the delta value.
VALUE T YPE |
TOOLTIP |
Actual value |
|
Absolute variation |
|
Percent variation |
|
Percent of target |
|
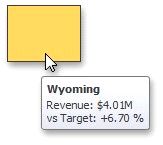
![]() Result Indication
Result Indication
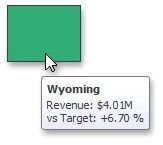
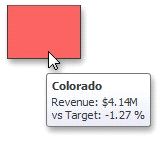
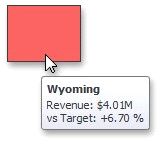
You can specify the condition that will be used to select the indicator color. To do this, use the Result indication combo box.
RESULT INDICATION |
AREA COLOR |
Greater is good |
|
Less is good |
|
Warning if greater |
|
|
|
RESULT INDICATION |
AREA COLOR |
Warning if less |
|
No indication |
|
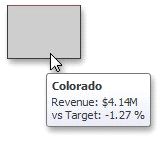
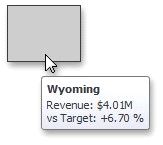


![]() Threshold type and Threshold value
Threshold type and Threshold value
You can specify that a required indicator should only be displayed when the difference between the actual and target values exceeds a specified value. For instance, the actual value exceeds the target value by 10%, or by $2K.
Use the Threshold type combo box to select whether you wish to specify the threshold in percentage values or in absolute values. Then use the Threshold value box to specify the threshold value.
The Format tab allows you to specify the numeric display formats for for different value types, as described in the Formatting Data document.
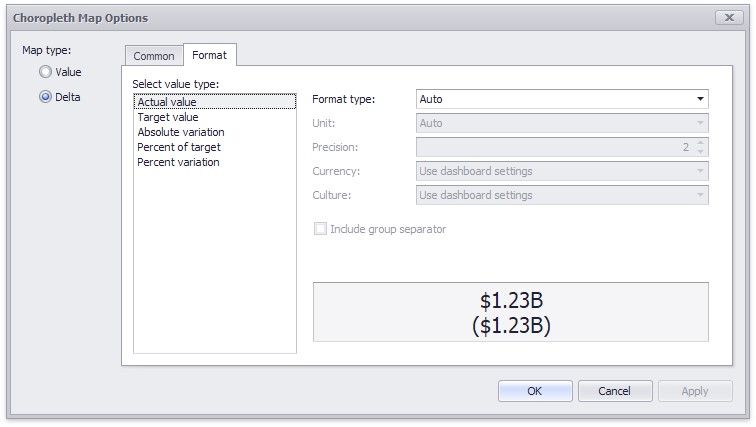
The tab contains the following settings.
Format type - Specifies format types for numeric values.
Unit - Specifies the unit to convert the numeric values.
Precision - Specifies the number of fractional digits to display.
Currency - Specifies the currency symbol and format provided by the current culture settings.
Culture - Specifies the name of a culture that defines the currency symbol and format.
Include group separator - Specifies whether separators should be inserted between digit groups.