Power BI Desktop connects to many types of data sources, including local databases, worksheets, and data on cloud services. Sometimes when you gather data, it's not quite as structured, or clean, as you want it to be. To structure data, you can transform it, meaning that you can split and rename columns, change data types, and create relationships between columns.
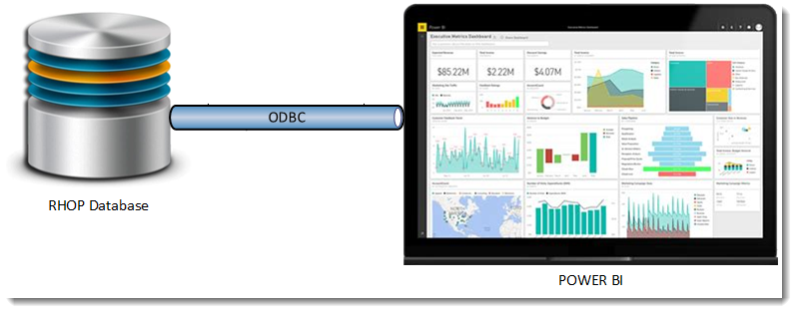
You can connect Power BI Desktop to many types of data sources, including RHOP, Microsoft Excel workbooks, and cloud services including generic sources such as XML, CSV, text, and via other ODBC connectors.
Connect to data
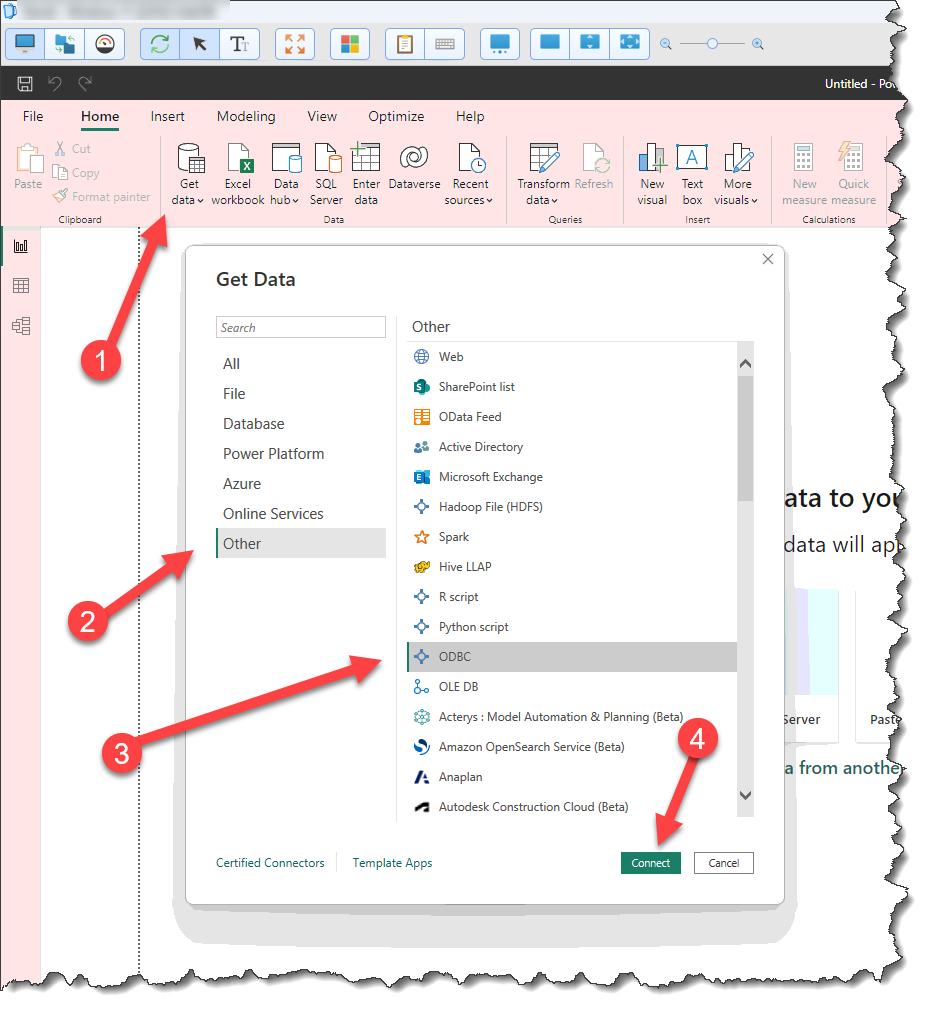
When you start Power BI Desktop, you can choose Get Data (1) from the ribbon on the Home tab. Select the Other (2) option and then select the ODBC(3) connector. Select Connect (4) button to display the ODBC connector.
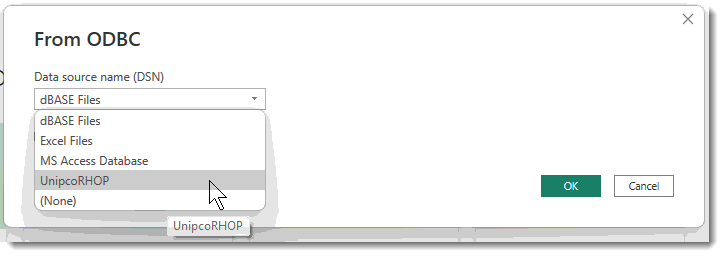
The ODBC connector select screen will be displayed. It will list all ODBC connectors installed on your PC. Select the UnipcoRHOP connector
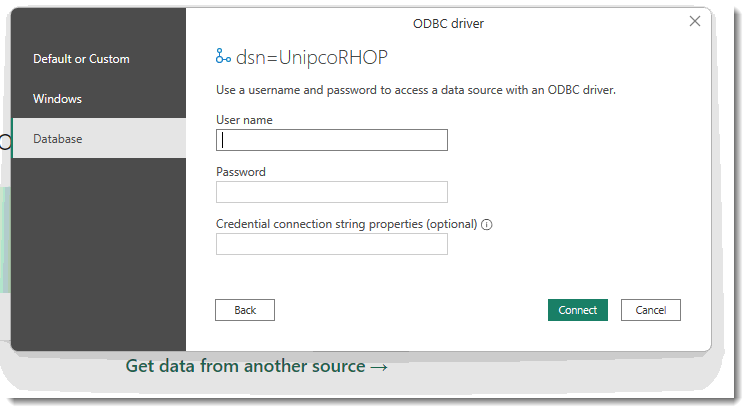
The ODBC credential screen will be displayed. Enter the Power BI User name and Password provided by your administrator. Press the Connect button to establish the connection from Power BI to RHOP.
Once the connection is established the Navigator screen will be displayed. The Navigator screen permits the user to select (1) (place a check mark) beside each table required for the dashboard/report. Once a table is selected the fields contained in the table are displayed on the right side of the screen (5).
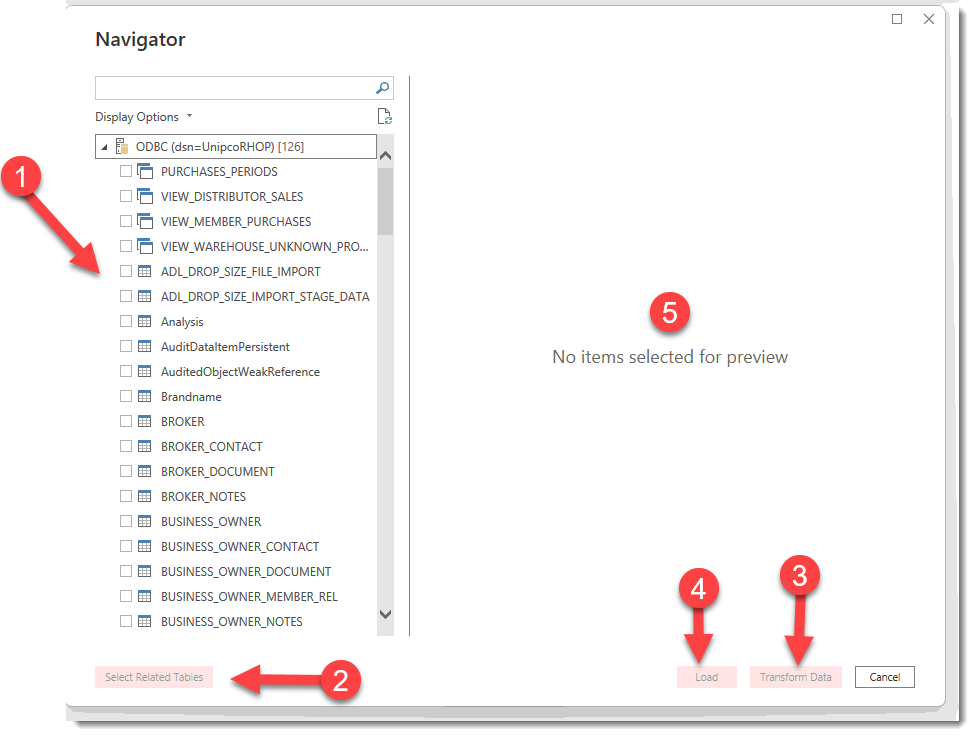
(2) Select Related Tables button will automatically identify (via RHOP meta data) the relationship between tables and attach all tables defined as able to be joined for the tables selected. (this action can in certain circumstance have the same table appear multiple times to reflect all secondary keys attached to the Table). Also it may cause large Tables to be automatically added (purchase table). Users should review the tables selected (check marks) to determine if all tables connections are required and remove any joins/tables not required.
(3) Transform Data button allows users to define the various filters to apply to the data before it is retrieved from the RHOP database. For example, a report creator might create one or more parameter(s) that restricts the data retrieval process to a single region/member plan, or parameter(s) that defines acceptable formats for fields like a date range, and specific text. See: Add filters to datasets, data regions, and groups in a Power BI paginated report - Power BI | Microsoft Learn
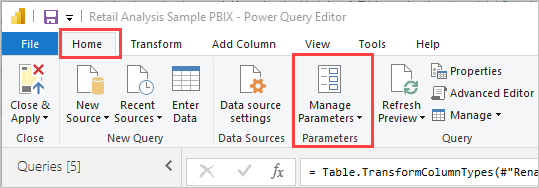
In the Transform Data screens, a user can rename fields and tables. Manual editing of the retrieved data is also available (Note: that the manual changes to the data are only effective in the Power BI template you are creating. It does not change the RHOP data or data selected in other Power BI templates.) See Transform, shape, and model data in Power BI - documentation - Power BI | Microsoft Learn.
IMPORTANT:
The Data Filtering at the table level affects only the data retrieved when using the Load or refresh button. The Dashboard/Report makes available other filters types that users can modify on demand. These report filters will only apply the filter on the data already downloaded. For example : A user selects 3 years of raw data to be downloaded. The report template can give the end user the ability to select any date range /quarter / year / period or date within those 3 years of data.
|
(4) Load button. Once you have transformed (filtered) the data to retrieve, the Load button downloads the selected filtered data. Note: depending on the amount of data to retrieve this task can take several minutes.