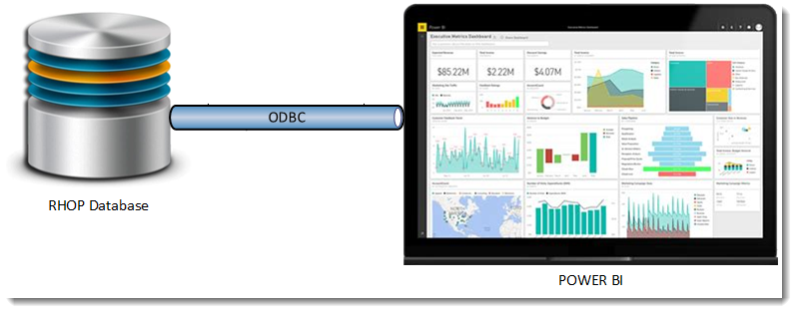
Power BI extracts data from the RHOP database, analyzing the data to create visual representation.
DATABASE: The RHOP database is made up of Meta Data, Tables and Fields.
•The Meta Data describes how the database is built/organized (Tables, Fields, Views, columns, data type, Constraint, Table Relationships/objects, etc.)
•The Tables are the containers for the Fields/data available in the database. By grouping common data into distinct tables provides the flexibility and speed of a relational database. RHOP has over 122 tables that have one or more relationships to other tables. The Meta Data of the tables describes how the tables are organized such as the properties of the table and the relational relationships (links/joins) to other tables. For example the Members table has relationships with other tables such as the Business Owners table, Members Contacts table, Members Notes, Members Documents, etc.
The tables relationships are created by using links/joins to each table via either a Primary key or Secondary keys. Keys are common fields that exist in both tables. For example the primary field could be Member ID which is common to one or more tables. Linking/Joining the tables together using this key makes all the data contained in each separate table available to the Members analysis.
Tables can be visualized in a way that is somewhat similar to a spreadsheet, in that like in a spreadsheet the columns represents each data field available (such as the fields available in an invoice) and the row represents a single data record (the data of a single invoice). When linking multiple tables together, the available columns of all linked tables can create one massive record.
•Fields are the containers that actually contains the data. The Meta Data of each fields contain among other items the various properties of the field. The defined field property type could contain text or numbers or an image, etc. For example the Member table contains the field called "Establishment Name" a text field that contains the name of the establishment.
ODBC Connector: The ODBC connector connects the RHOP database to Power BI.
•The ODBC is a conduit that translates commands sent and received from Power BI and the RHOP database.
•The ODBC connector is unique to a specific manufacturers data source product. ODBC connectors are not interchangeable, you must use the ODBC connector specifically built for the data source being use (hundreds of different ODBC connectors are available - Power BI supports over 120 different ODBC connectors).
•The role of the ODBC connector is to translate data request from Power BI to a format understood by the RHOP database. Once the RHOP database has retrieved the requested information/data it sends it to the ODBC connector that then take the data sent by the RHOP database and translates it to a format that Power BI can understand.
•The ODBC connector is very efficient in transferring data, making the transfer of data extremely fast. However, the transfer time is limited by the level of usage of the Network, Server and PC in sending and receiving data (highly used or not).
•The ODBC connector requires very specific credentials (user/password) to be authorized to connect to the RHOP database. These credentials insures that a user can only retrieve information from the authorized RHOP tables. The RHOP administrator can provide the authorization credentials.
Power BI: is an applications that retrieves data from various data sources for analysis (Data Mining).
•Power BI uses the meta-data, primary keys and secondary keys to combine the data in a format it can use to analyze and create dashboards and reports. In most instances Power BI will automatically determine the relationships (joins) between the many user selected RHOP tables. Users should only need to manually define the tables relationships (joins) in very unique or very complex situations (request assistance from Accra support staff).
•The dashboards/reports can use live data (regularly refresh) or a static selection of data. In most instances, users should place some sort of filter before having Power BI download the data since it may represent very large data sets.
Power BI stores the definitions of dashboards/reports in templates that can be distributed to users. Templates contains the configuration of the Dashboard/Report and the static data required and saved in the dashboard/report template to function properly. It is important to understand that Power BI will download all the data, required or not, unless filters are applied. Hence if you do not filter the data and download the 11+ million records contained in the Purchase table, it will take some time for your server to send and for your PC to be able to load the data for use in Power BI. It is also important to understand the amount of data to be transferred when you are using multiple tables (standard situation). Depending on what tables, if no filter has been first applied, will be downloaded you are potentially downloading all the data from each table selected (multiple times). see: Add filters to datasets, data regions, and groups in a Power BI paginated report - Power BI | Microsoft Learn
•The user must establish for each unique Dashboard/Report one or more connection(s) (ODBC Link to RHOP) and identify the tables to retrieve. Most dashboards/reports will use more than one table. Users should have a basic understanding of what information is contained in each table. Tables are named using either the old Velocity names or RHOP descriptive names indicating what the table contains. The user must also define the filters to apply before retrieving the information (period/range/specific item/range of members/etc.) or all data will be downloaded.