The RHOP data is stored in a Relational Database. The RHOP application uses the concept of Objects to access and manipulate the data. An Object is a data construct that groups into one object/class the fields, attributes, properties related to the object definition.
For example, the Member object contains all tables, fields and properties associated with an RHOP member. Therefore in the RHOP report designer screen, when you select the member object, you will see all fields and related links(relationships) to other tables, fields, objects that are associated with the Member object.
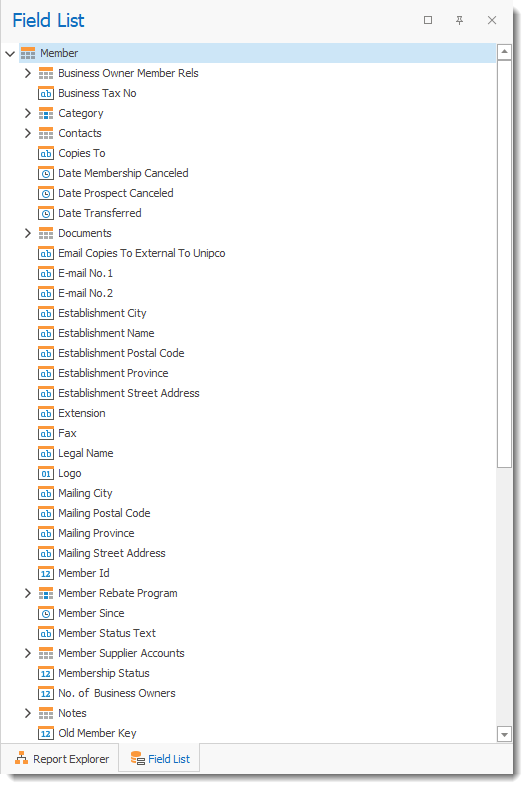
Items having the > sign before their names represents data relationships such as other objects(files/list/etc) that are used by the Member Object.
Example the Region object is linked to other files/tables/objects/fields making up the Region object
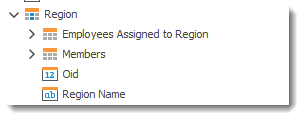
For reporting purposes if you are trying to display the name of the region, you would only select the object Region with no sub object such as "Region.Region Name."
![]()
![]()
The correct usage is
![]()
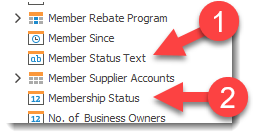
You also need to know that some fields, display the actual text associated with the name of a field, versus some are logical links representing the value or text of a field.
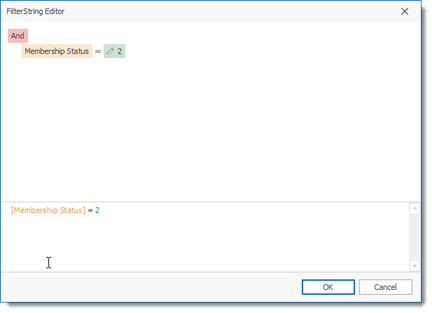
For example the fields "Member Status Text" (1) is the actual text value of the status (i.e. Cancelled Member) and this object contains logic to display the correct name based on the field called "Membership Status" (2) which contains the status value ID.
The Membership Status fields contains 5 numeric values that links and indicate the actual status of the membership status.
the values the Membership Status field contains are: 1,2,3,4 and 5
1- represents Prospects (active)
2- represents Member (active)
3- represents Cancelled Prospect
4- represents Cancelled Member
5- represents a Transferred Member
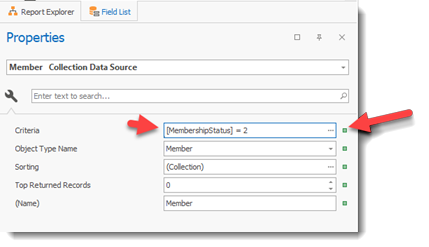
By entering a filter string for the data (Member) you can for example select only the Active Members
View Variants :
View Variants are different views of the same data. in other words it is a look at the base data with filters and sorting and grouping applied to create a unique view of the data being examined. Common View Variants are data that are filtered based on a status ( active/non-active) or based on a date range or sorted or grouped to better identify trends or key information contained in the data. These custom Views allows the user to quickly access the data they are looking for. many of the grids allows the user to create on the fly their own custom views and variants by using the grid bilt-in filtering and grouping tools.