The Reports section displays all reports available in RHOP based on the users security profile.
Basics for How to Create Reports
Step 1: Navigate to the report section (1 & 2)
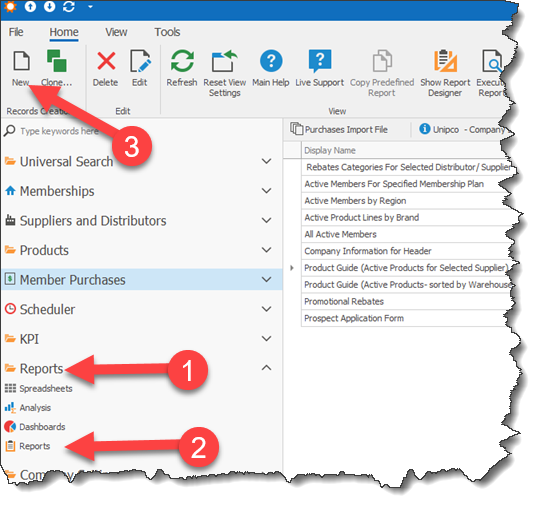
Step 2: Create the Report (3) by selecting the New button.
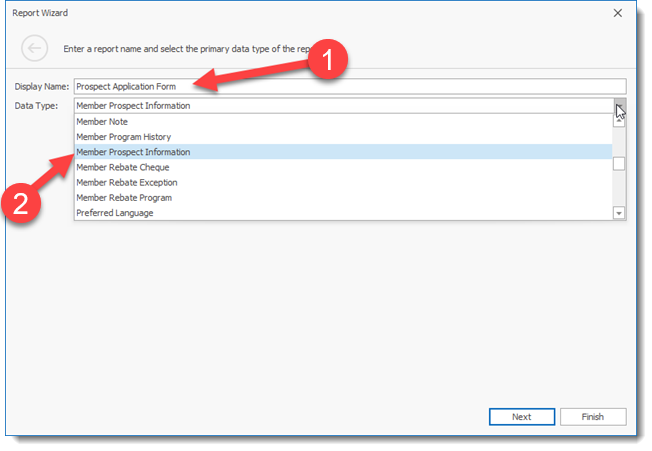
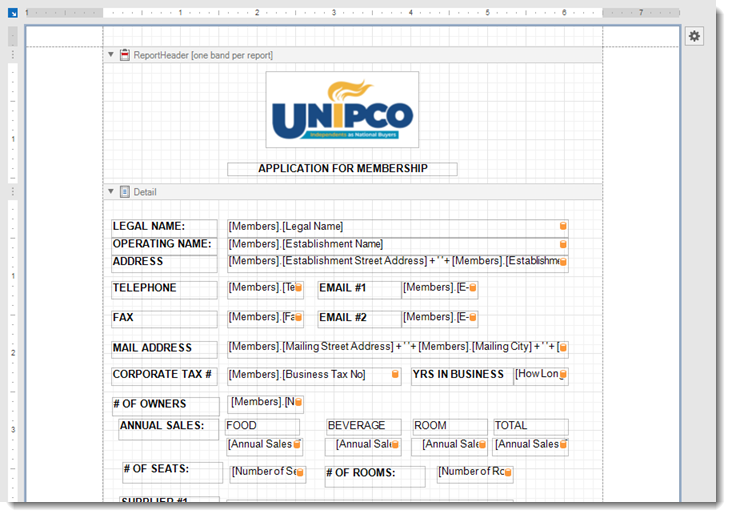
Step 3: Name your report (1) and select the Data Type i.e. object (2) you want to report upon. In this example we are naming the report The Prospect Application Form and using the object Member Prospect Information that contains all information on a member prospect.
Step 4: Click the Next button and select the format for the report. For most reports it will be a Table report, however in this example we will use the Blank option to create our form.
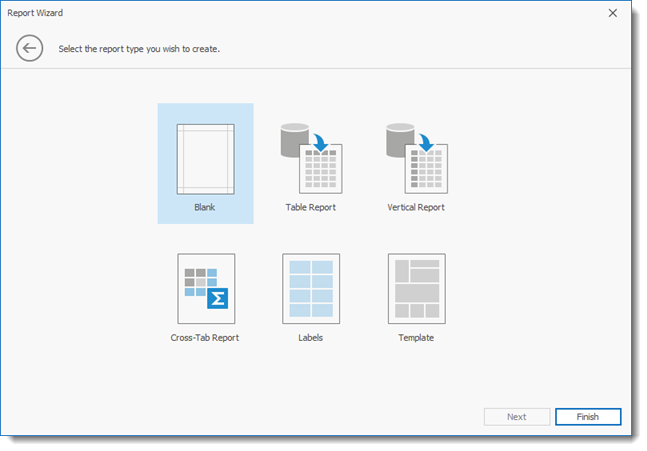
Step 5: Click Finish to open the Report Editor / Designer screen.
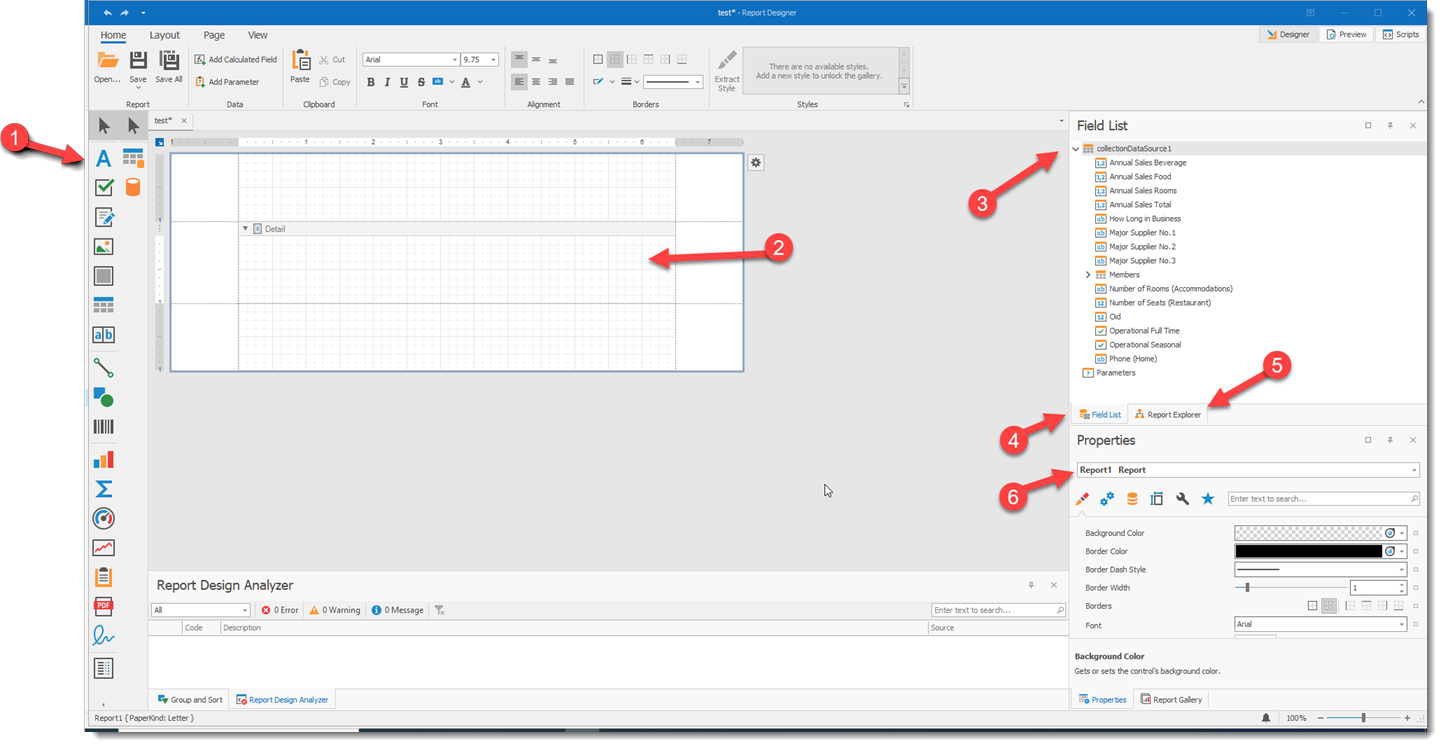
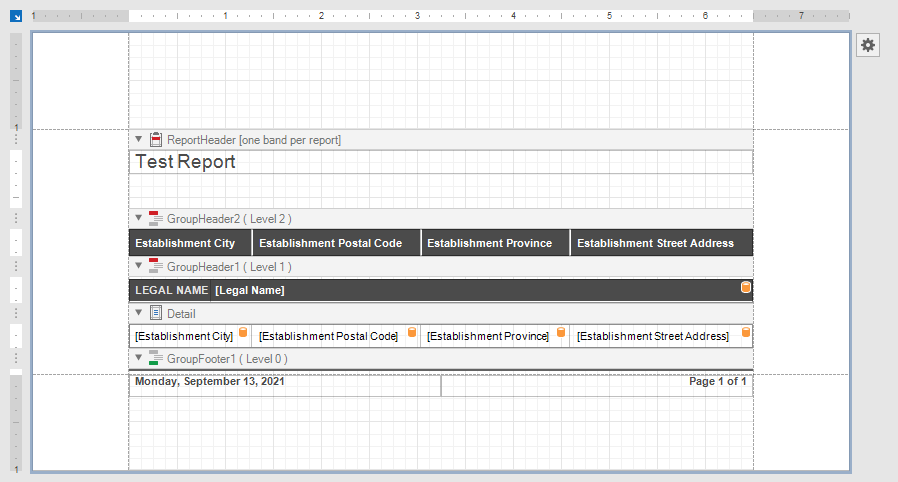
The Report Designer is where you build your report.
1) Components you can use to create your report
2) Reports are build by entering the components/fields you want to display in your report in the various bands available. By default you will always have a detail band since this is linked to the data type your selected.
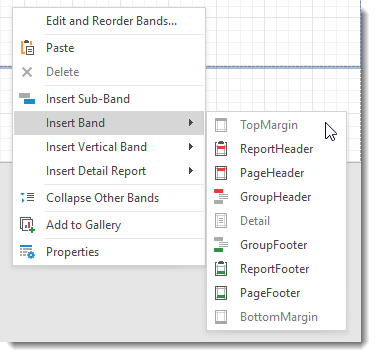
Various bands exit for specific task you want to accomplish. You can add the Bands you need for your report.
3 & 4 ) The Field List tab display all the fields available for your report
5) The Report Explorer displays the structure of your report and allows you to re-order the placements of fields in your report.
6) The Properties tab permits you to change the properties such as the name of the selected report / section / band /component / field in your report. Each item in your report has specific properties/options available to you such as color, font, underline,features etc..
You can drag and drop the various components and fields you wish yo use for your report.
Using Special Report Features
The Report Editor offers unique features that can make your life simpler. Below are some of the components you may want to use to standardize reports or make use of some interesting features.
Using Sub-reports to create a Standardize Report Header.
The Sub-Report component ![]() permits users to imbed an existing report into the report they are creating. In this example we have previously created a Company Information for Header report that can be used to standardize your report headers. The Company Information for Header report uses the Company Information data type to retrieve the company logo and address information.
permits users to imbed an existing report into the report they are creating. In this example we have previously created a Company Information for Header report that can be used to standardize your report headers. The Company Information for Header report uses the Company Information data type to retrieve the company logo and address information.
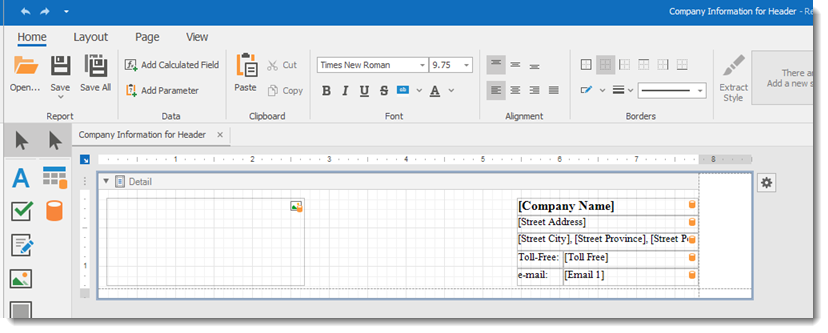
The new report All Active Members report imbeds the Company Information for Header into its header to provide the Logo and address information. By dragging the Sub-report component in the Report header band we can link the sub-report to our previously build report called Company Information for Header.
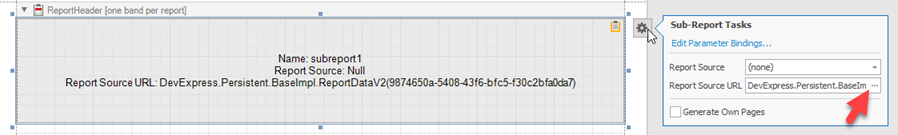
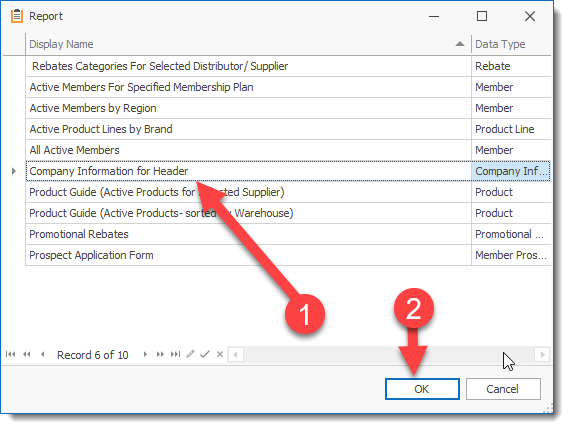
Select the gear beside the Sub report component and select the the report Source URL button to select the report to imbed. Move in the displayed list by using your up/down arrows on your keyboard to locate the appropriate report to imbed. and once the report is selected click on the OK button to save your selection.
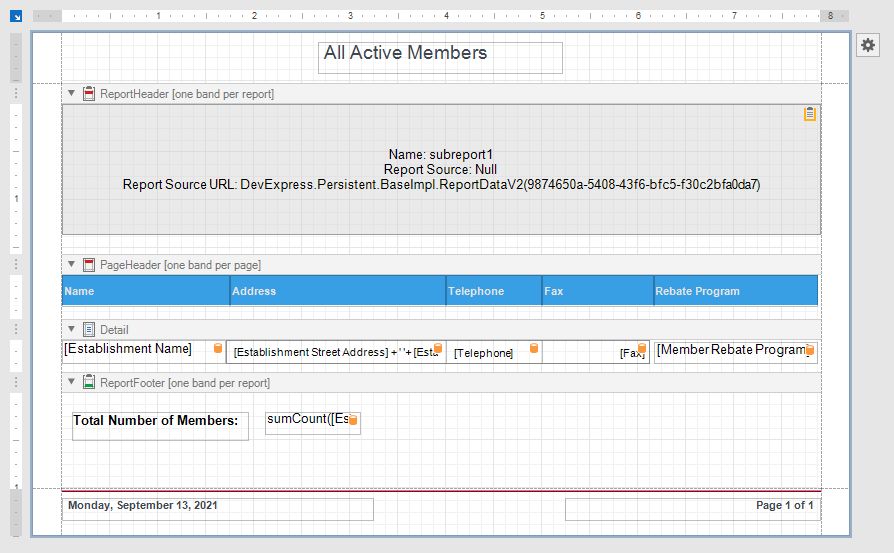
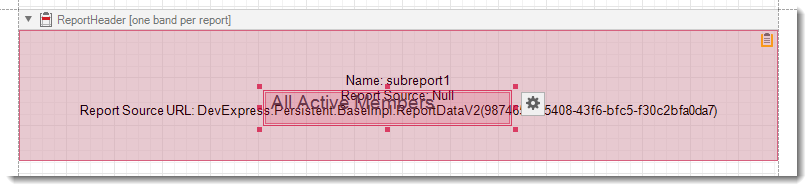
You can move the Report Title ( All Active Members) in the middle of the sub-report to print the report title over the sub report section. Note that the report editor will color the move in RED to identify that 2 fields are overlapping. In this case, this is what we want therefore you can ignore the error notice.
How to Record Signatures in a Report/Form
The report writer allows users to create a special section to allow a person to sign a report/form.
In the report or form drop an image Picture Box component ![]() in the form.
in the form.
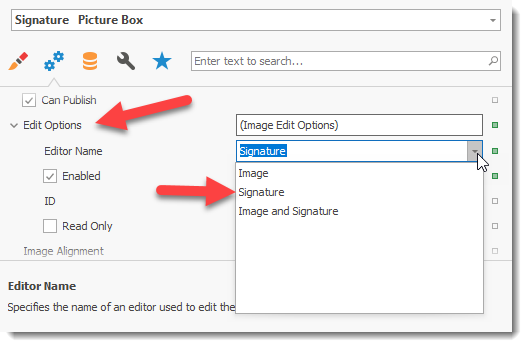
In the property tab for the Picture Box component select the Behavior ![]() icon and scroll down to the Edit Options. Select the Editor Name you want to use for the picture box. Selecting Signature allows a user to sign the picture box using a mouse or touch screen. The Image editor only allows Images to be inserted and the Images and signature editor allows both to be entered in the picture box component.
icon and scroll down to the Edit Options. Select the Editor Name you want to use for the picture box. Selecting Signature allows a user to sign the picture box using a mouse or touch screen. The Image editor only allows Images to be inserted and the Images and signature editor allows both to be entered in the picture box component.
Once the Picture box is set to use the Signature Editor a user can sign their signature.
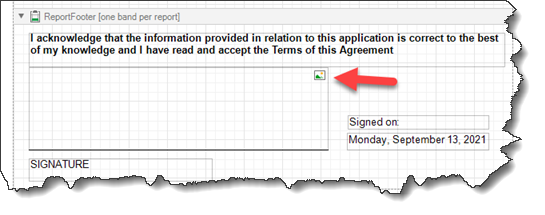
When the report/form is executed/run/previewed the Picture Box displays the options available when selected. the pencil is to record the signature and trash can is to delete the signature entered in the Picture Box.
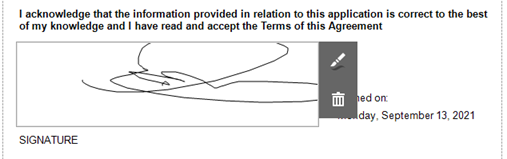
Once the signature is captured the user can print or save the form with the signature captured.
Using Color and Underlines in Reports
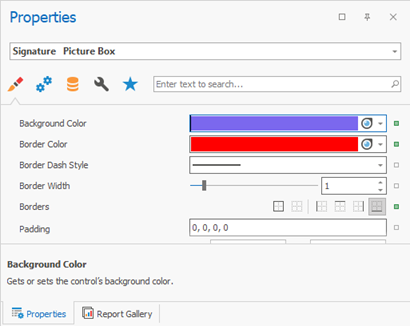
Components can be colored or underlines to make the data easier to read.
The properties tab gives the user the ability to change the color of the component as well as use various lines and borders to highlight the data field.
Using the Report Wizard
The report Wizards gives you quick access to creating reports. When a user select the New button to create a report the Report Wizard is automatically displayed. Users can choose various options that will create a default report based on the selection the user selected. From this base report the user can then modify the report to their needs.
Step 1: Enter a report Display Name and select the Data Type ( object) you wish to use for reporting purposes. In this example the member Objects provide all information related to all Member.
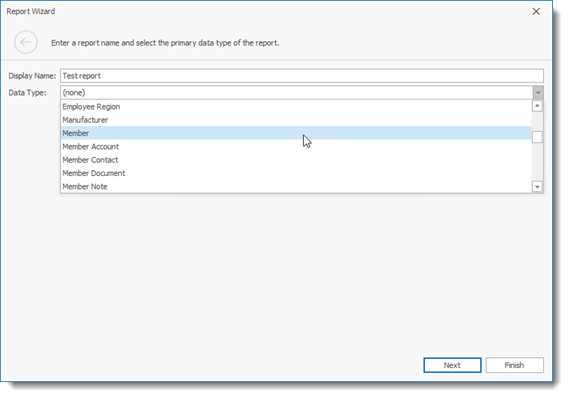
Click the Next button to move forward in the Wizard
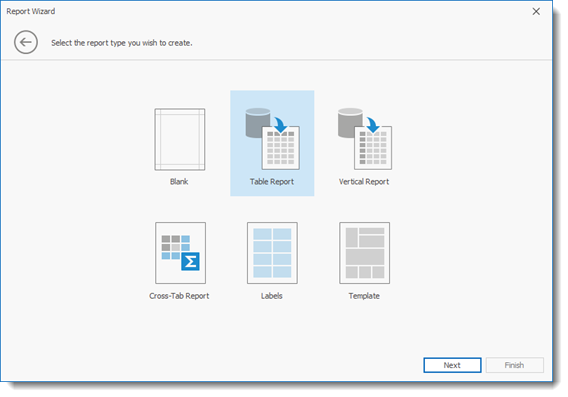
The Next screen defines the layout of your report. By default the Table Report is selected but users can choose the format that best meets their need.
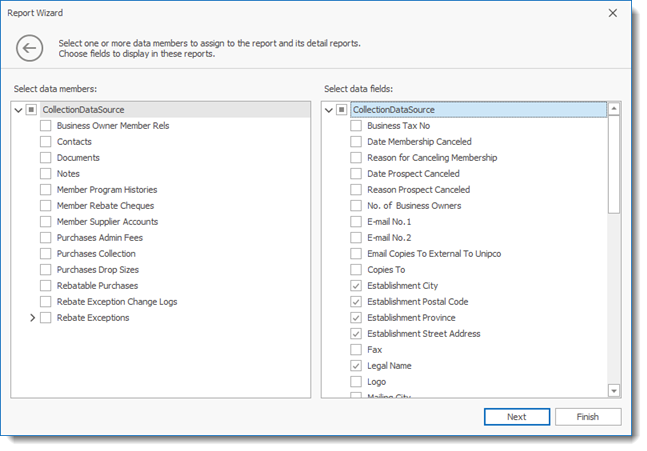
By selecting the Data source listed will display the fields and sub tables available to the user. Placing a check mark beside the fields you want to display in your report will automatically add these fields to the report. A user can also manually add fields to a report by using the drag and Drop option available in the Report Writer.
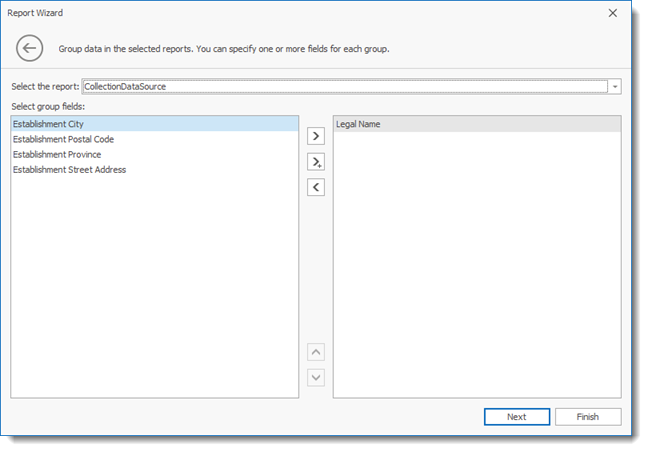
The grouping screen (optional) allows users to use a field for grouping the information to be displayed. In the above example we are grouping the information for each Member together. the report can display multiple members and regroup the info for each member.
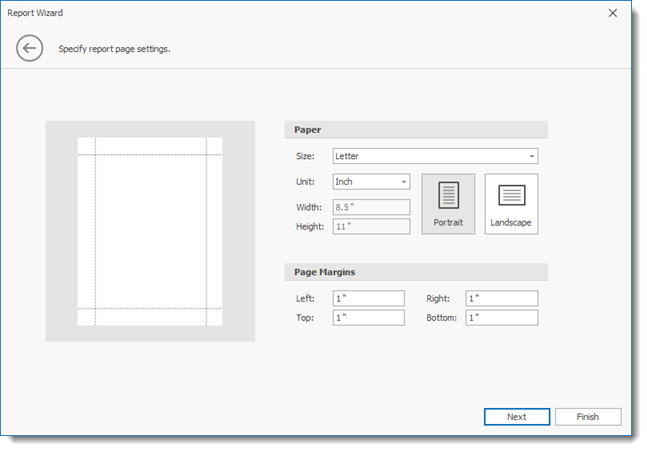
Users can define the page layout of the report
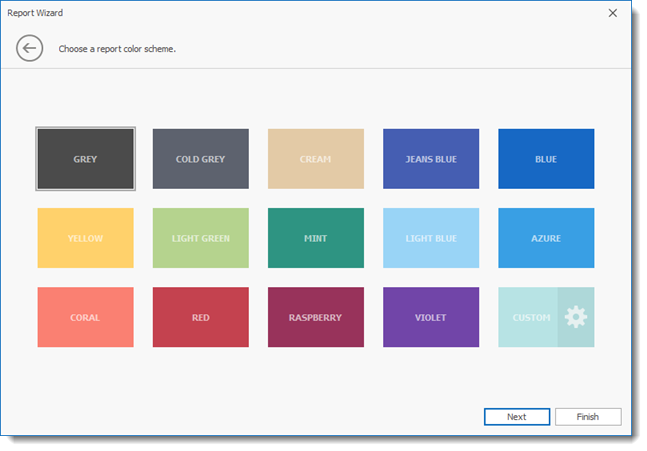
Users can define the color scheme to use for the report
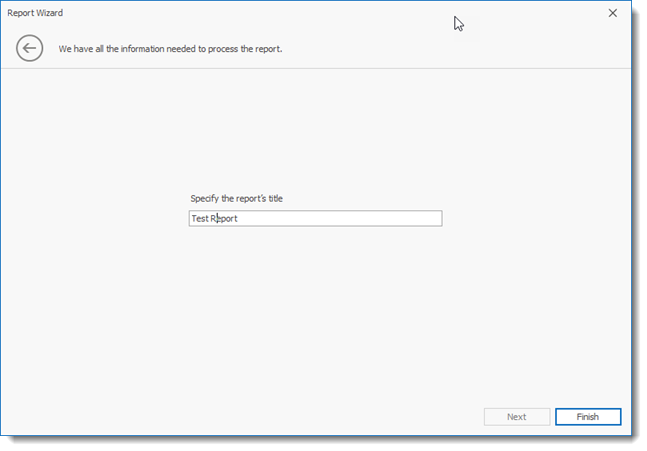
Users can define a Title for the report and then select the Finish button to enter the report editor.
Using the Report Designer to Edit a Report
The Report Designer  permits users to edit existing reports. Highlight the report you wish to edit and select the Show Report Designer to open the Report Editor/Designer.
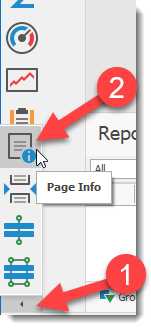
How to Add Date and Pages info in a Report
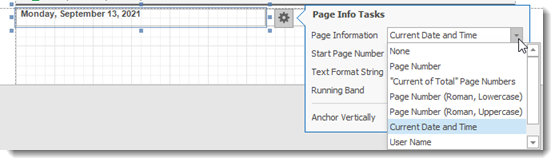
The report Writer has a Page Info component that displays several items.
To add a date select the Current Date and Time option.
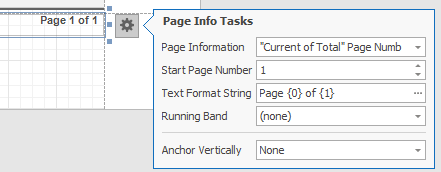
To add Page Numbers select the Current of Total Page Number option and add the Text Format String to display the format of the page number ( Page {0} of {1) )
How to Preview Reports
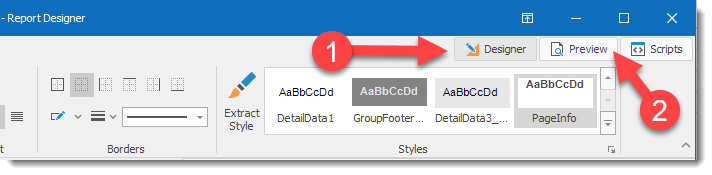
The report editor has located to the right top of the screen 3 tabs.
1) Designer : displays the designer screen
2) Preview : displays a Preview of your report
3) Script: Advanced feature allowing users to write scripts (code) for the report.
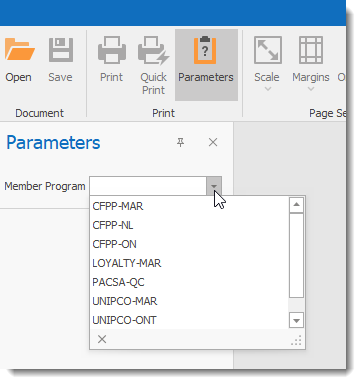
How to Prompt User for Data Selection in a report
You can prompt for the user to select the data parameters they want to report upon.
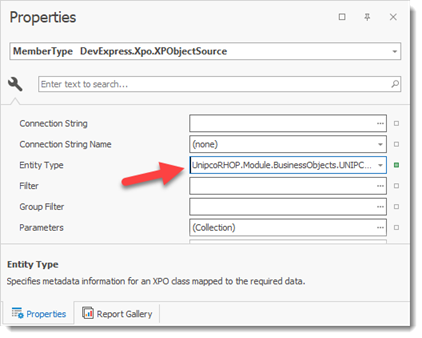
Step 1: You must create a new data source to look-up the parameter the user will use to select the report information. Drag the CollectionDataSource ![]() on the report. This will create a new data source. You can link the datasource with the data object you want to use for the lookup. Select in the Properties tab the Entity Type (object) to use.
on the report. This will create a new data source. You can link the datasource with the data object you want to use for the lookup. Select in the Properties tab the Entity Type (object) to use.
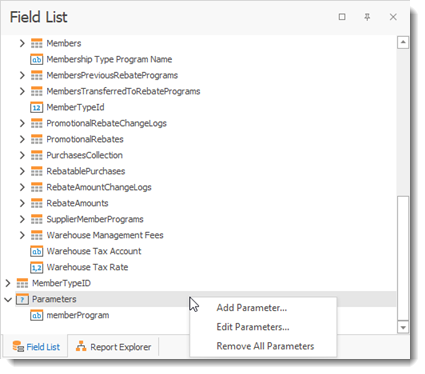
Step 2: Create a Parameter entry in the Field List. Right click the parameters option and select Add parameter..
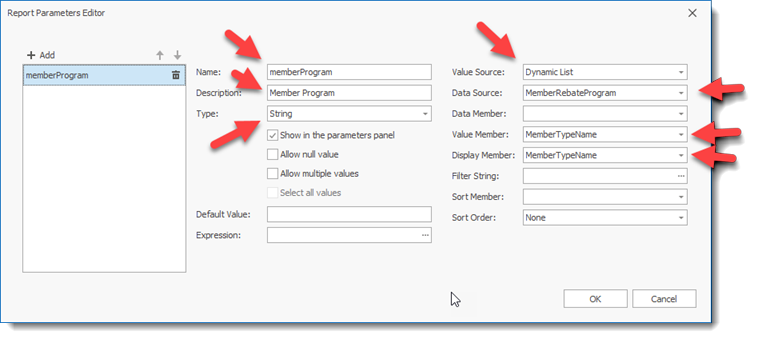
The Parameter editor is displayed. Enter a name, description for the parameter. Select Dynamic List to read the list from a table or Static to type in the available values. Select your datasource, The Value Member (field to lookup) and the Display member (field to display as parameter). If the field you are looking up is a number use Integer 64 for Type or if the field is a word use String for the Type.
Step 3: Add a Criteria on your base data source to filter the data based on the selected parameter.
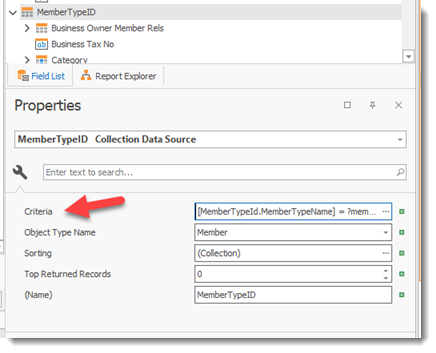
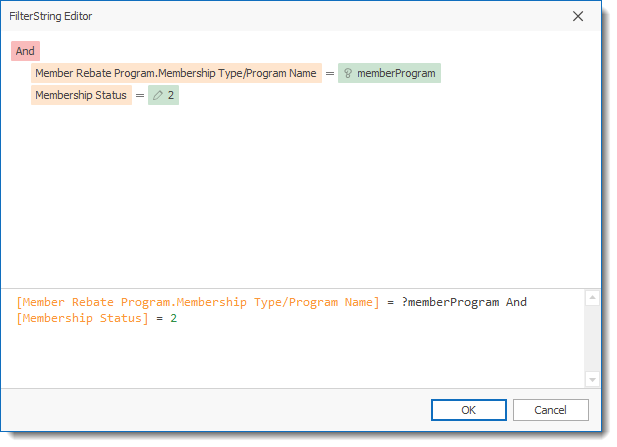
The Filter String Editor allows you to create filter criteria on your data. In the example above we have 2 filter criteria.
1) Membership Status = 2 ( the number 2 means the member is active)
2) Member Rebate Program membership Type/Program Name = ? memberProgram ( the ? means that it will use the result of the parameter we created in step 2 above.
To Add a condition select the + sign beside the Add statement and select Add Condition option..
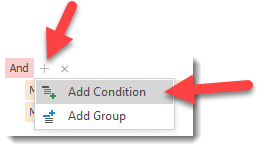
A Condition line will be created. The first field permit the user to select the field to filter upon. The second field is the logical operator to apply to the filter.
![]()
The third field is the type of value to use. Three options are available when you click icon on the field:
1) ![]() The Pencil is for a static value that the user must manually enter
The Pencil is for a static value that the user must manually enter
2) ![]() The compare field to another field option. Select the field to compare.
The compare field to another field option. Select the field to compare.
3) ![]() The parameter field which allows the user to select from the parameters created for the report. select the correct parameter to use.
The parameter field which allows the user to select from the parameters created for the report. select the correct parameter to use.
Once you have properly created all items described above your report is ready for testing and use.