Filter Data
The topics in this section describe different approaches to filtering data in your reports:
![]() Filter Data at the Report Level
Filter Data at the Report Level
Use the report's settings demonstrated in this tutorial if you want to load the entire dataset and filter it on the client.
Filter Data at the Data Source Level
Filter records at data source level using your data connection query if you are binding to a large data source and want to speed up the retrieval process.
Limit the Number of Records to Display
Options described in this topic allow you to emulate the Top N feature in a sorted report or increase the Print Preview performance by rendering only a subset of a report’s data.
Filter Data at the Report Level
This tutorial illustrates how to filter data at the report level, as opposed to the data source level. This approach is useful when dealing with relatively small data sources, when data load times are acceptable.
1.Create a new report or open an existing one.
2.Bind you report to a required data source. See the Bind to Data section to learn more about providing data to reports.
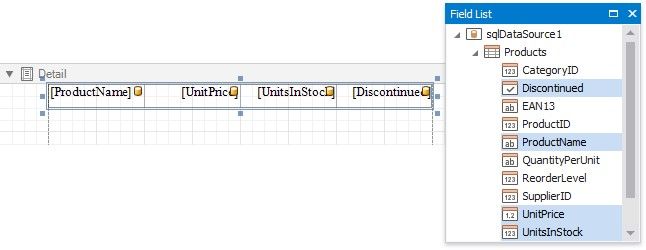
3.Switch to the Field List and drop the required fields onto the report's Detail band.

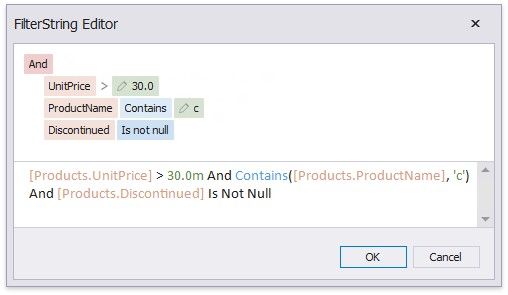
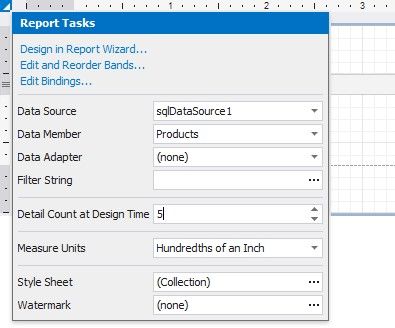
4.Click the report's smart tag and click the Filter String property's ellipsis button.
In the invoked FilterString Editor, construct an expression in which the data fields are compared with the required values.
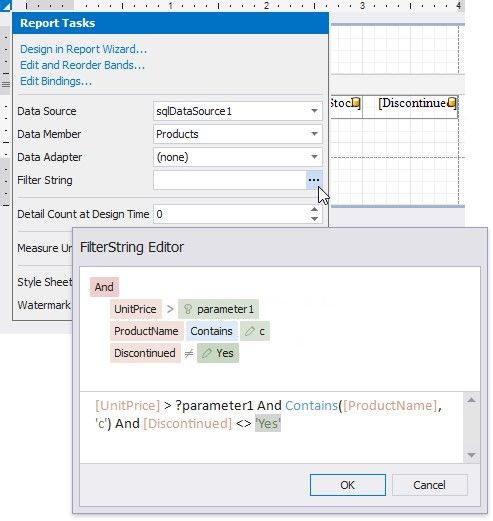
Every filter condition consists of three parts:
A field of a data source to which a report is bound or the name of the calculated field, which exists in this data source at the same level.
Criteria operator, such as Equals, Is less than, Is between, etc.
A static operand value, another data field or a report parameter. To access parameters, click the icon on the right until
it turns into a question mark.
You can arrange specific conditions into groups with And, Or, Not And, and Not Or operators.
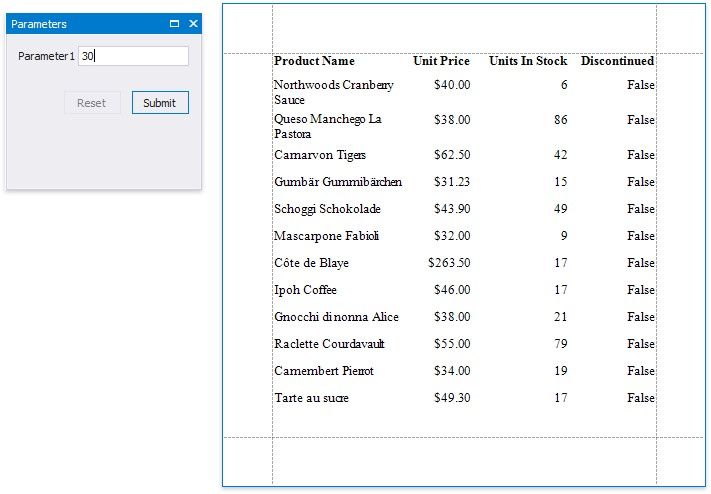
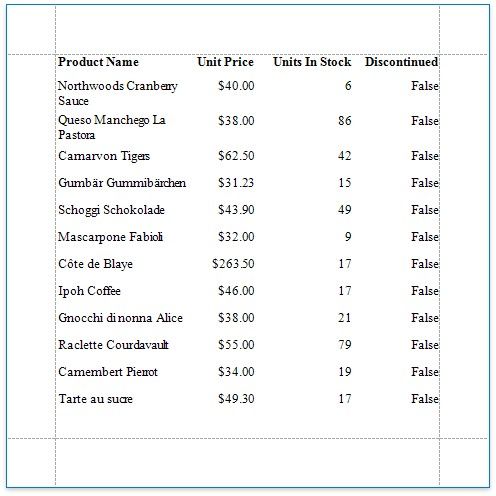
Your report is now ready to be generated. Switch to Print Preview to see the result.
Filter Data at the Data Source Level
This tutorial illustrates how to filter data at the report data source level, as opposed to the report level. This approach is recommended when dealing with comparatively large data sources when the retrieval process is slow.
1.Create a new report or open an existing one.
2.Bind you report to a required data source. See the Bind to Data section to learn more about providing data to reports.
3.Switch to the Field List and drop the required fields onto the report's Detail band.
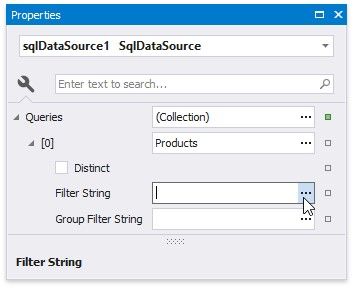
4.Select the data source in the Report Explorer, expand its Queries collection property in the Property Grid and click the ellipsis for the Filter String property of the required query.
5.In the invoked Filter Editor, construct an expression where the data fields are compared with the required values as shown below.
Every filter condition consists of three parts:
A data field name.
Criteria operator, such as Equals, Is less than, Is between, etc.
A static operand value, another data field or a query parameter. See the Specify Query Parameters topic to learn about embedding these parameters into filter conditions.
You can arrange specific conditions into groups with And, Or, Not And, and Not Or operators.
Alternatively, you can specify a filter expression when creating a query using the Query Builder. To invoke the Filter Editor at this stage, click the Filter... button.
Switch to Print Preview to see the result.
Limit the Number of Records to Display
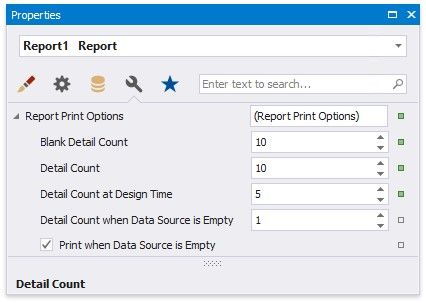
You can filter records displayed in Print Preview using Report Print Options. You can specify them in the Property Grid's Miscellaneous tab.
Limit the Number of Records
The Detail Count at Design Time property enables you to limit the number of records a report shows in Print Preview embedded into the Report Designer. This option is also available in the report's smart tag.
Use the Detail Count option to define how many times to print the Detail band when generating a report document to display in Print Preview.
Print on Empty Data Source
Disable the Print when Data Source is Empty option to avoid generating a report when its data source is empty. You can use this setting in master-detail reports to hide the detail report if its data source contains no records.
The Detail Count when Data Source is Empty property allows you to specify how many times to print the Detail band when a report does not have a data source. You can use this property to create static reports that are not connected to a data source and display the same static content several times.