Cross Tab Fields
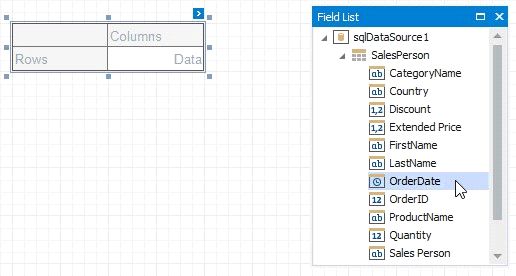
Drop data fields from the Field List onto cross-tab areas to define the control layout. The Cross Tab supports three field types (areas):
•Rows (the Row Fields collection) - displays field values as row headers.
•Columns (the Column Fields collection) - displays field values as column headers.
•Data (the Data Fields collection) - uses field values to calculate summaries at row and column intersections.
Row and Column Fields
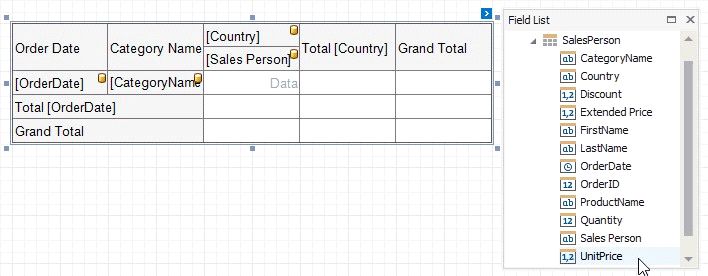
You can drop two or more data fields onto the same area to create a hierarchy. The first field's values are displayed at the root level (the first column/row), the second field's values are grouped by the first field's values and displayed at the second hierarchy level (the second column/row), and so on.\
Specify Row Fields
Specify Column Fields
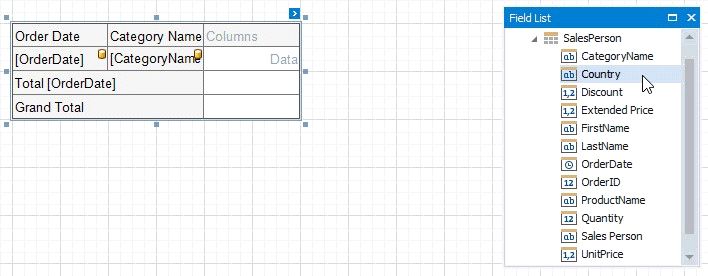
Cross Tab cells marked with a database icon become bound to the dropped fields. The corresponding rows/columns are printed in the document as many times as there are field values in the data source. The top left corner displays headers for row data fields.
Additional rows/columns are added to the Cross Tab to display total values calculated against these fields. The last row/column displays grand total values calculated against all the rows/columns.
Data Fields
You can add two or more data fields and arrange them in two ways:
•in a column, one under the other (field headers are displayed as row headers);
•in a row, one after the other (field headers are displayed as column headers);
When the data area contains only one field, the field header is not displayed.
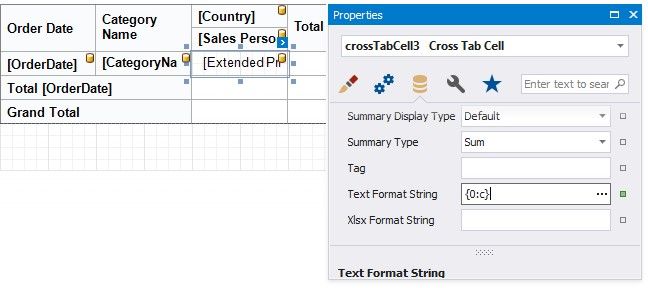
Format Field Values
Use a cell's Text Format String property to format output data.
You can also use the Null Value Text property to specify the text shown when a data field's value is null or empty.