Conditional Formatting
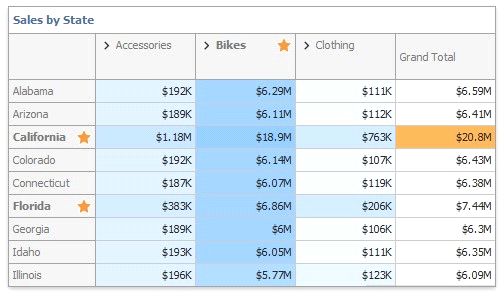
A Pivot dashboard item applies conditional formatting to cell values. You can calculate a format rule by measures placed in the Values section and dimensions placed in the Columns or Rows section.
Supported Format Rules
The following list contains available format rules and corresponding data types:
numeric
Value
Top-Bottom
Average
Expression
Icon Ranges
Color Ranges
Gradient Ranges
Bar
Bar Color Ranges
Bar Gradient Ranges
Value (with a condition type set to Equal To, Not Equal To or Text that Contains) Expression
date-time
Value
A Date Occurring (for dimensions with a continuous date-time group interval) Expression
Icon Ranges
Color Ranges
Gradient Ranges
Bar
Bar Color Ranges
Bar Gradient Ranges
Create and Edit a Format Rule
You can create and edit format rules in the following ways:
Click the Edit Rules button on the Home ribbon tab.
Click the measure/dimension menu button in the Data Item's pane and select Add Format Rule/Edit Rules.
Refer to the following topic for information on how to create and edit format rules: Conditional Formatting Common.
Pivot-Specific Format Condition Settings
You can configure and customize current format condition appearance settings.
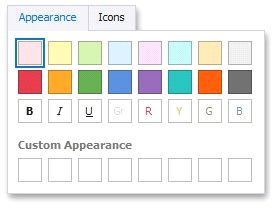
Choose a predefined background color/font or click an empty square to add a new preset in the Appearance tab.
Add a predefined icon in the Icons tab.
The Appearance tab contains the following Pivot-specific settings:
OPTION |
DESCRIPTION |
Enabled |
Enables/disables the current format rule. |
Intersection Mode |
Specifies the level at which to apply conditional formatting to pivot cells. |
Intersection Row/Column Dimension |
Applies the format rule to the specified row/column dimension, if you select the Specific Level as the intersection mode. |
Apply to Row/Column |
Specifies whether to apply the formatting to the Pivot item's entire row/column. |
A Pivot item allows you to specify the field intersection to which a format rule is applied.
INTERSECTION LEVEL MODE |
DESCRIPTION |
Auto |
Identifies the default level. For the Pivot dashboard item, Auto identifies the First Level. |
First Level |
The first level values are used to apply conditional formatting. |
Last Level |
The last level values are used to apply conditional formatting. |
All Levels |
All pivot data cells are used to apply conditional formatting. |
Specific Level |
The specified measures/dimensions are used to apply conditional formatting. |
The image below displays different intersection levels with the applied conditional format rule:
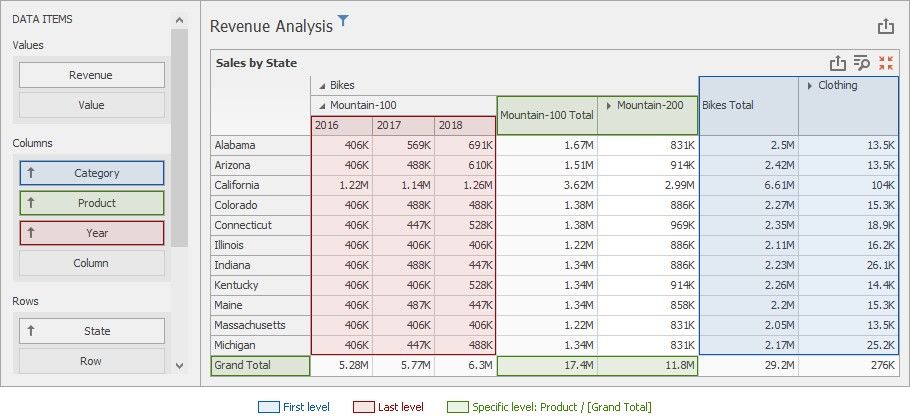
To apply a format rule to the row or column Grand Total, change the Intersection Level Mode to Specific level and set the [Grand Total] value as the intersection row/column dimension.
Note the following limitations:
1.The dashboard cannot calculate conditional formatting in a Pivot item for multiple range levels with percentage values. In this case, the "All Levels" intersection mode is not available for a conditional formatting rule.
2.The format condition dialog does not contain any Pivot-specific settings for a dimension from Columns and Rows.